Elections
| District | Position | Candidate | Affiliation | Phone | Website | |
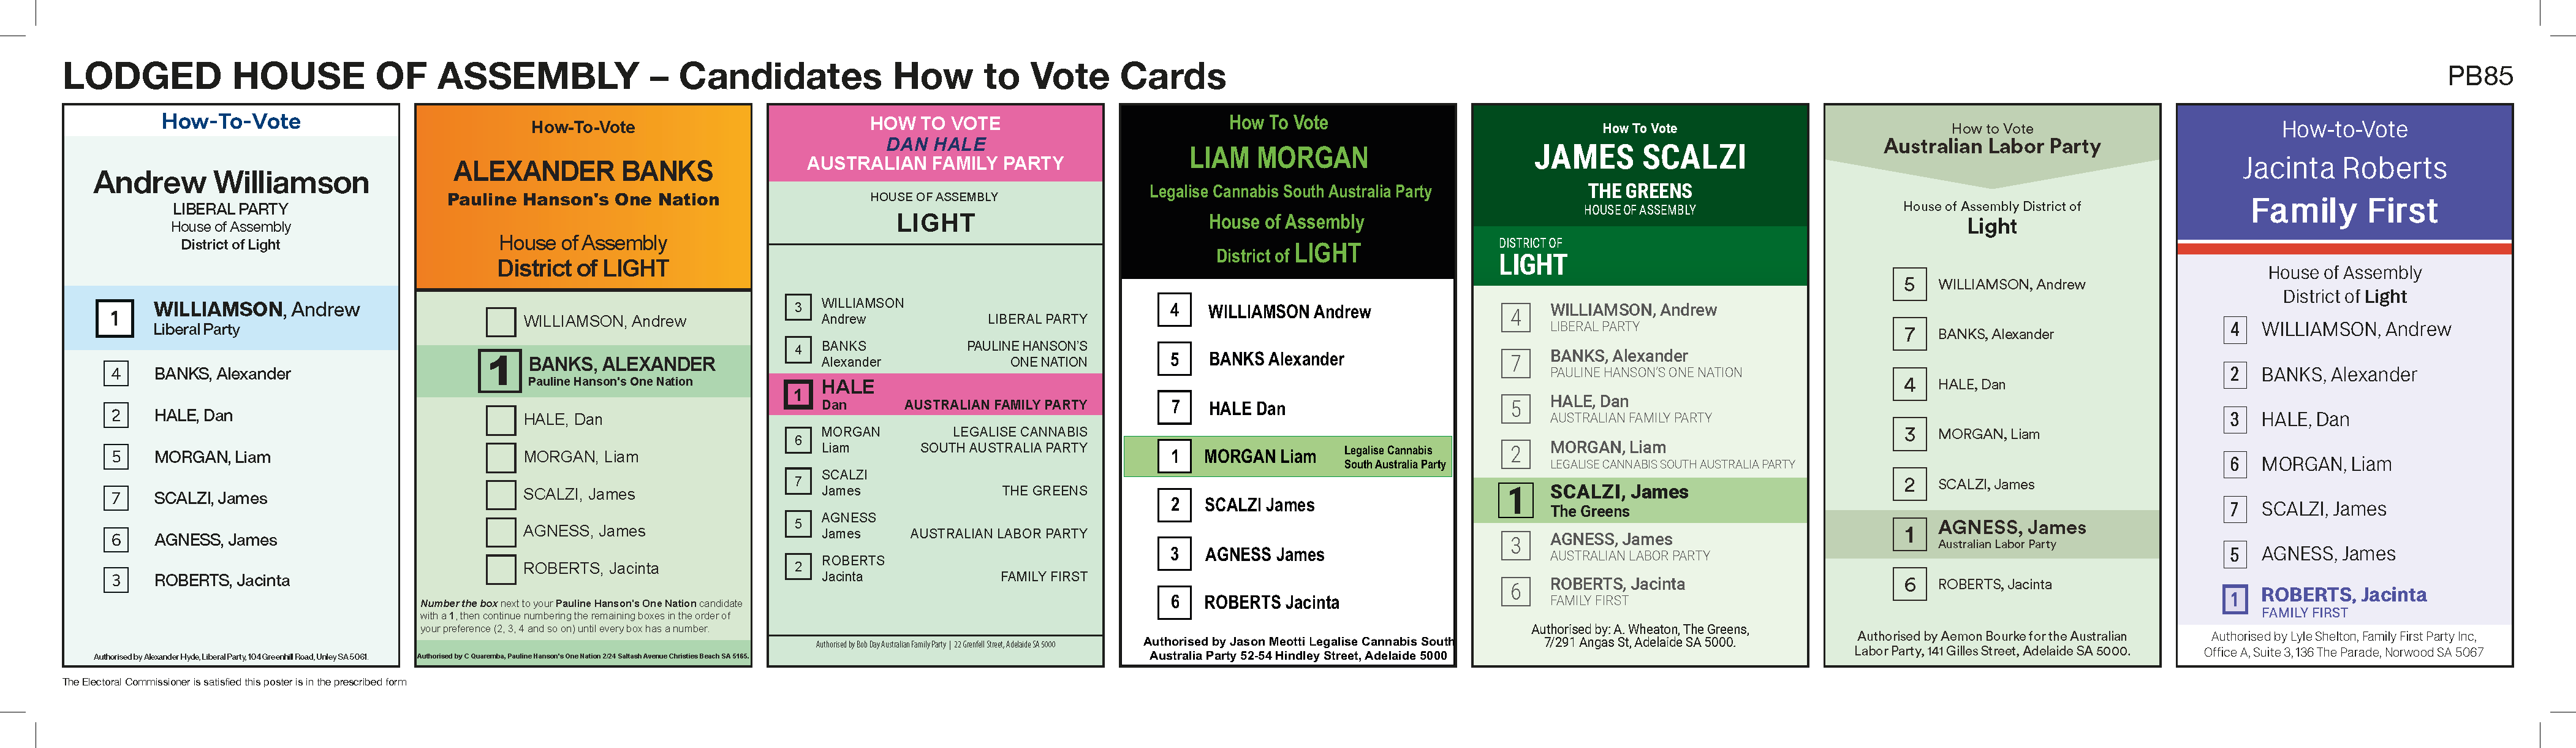
| Light | 1 | WILLIAMSON, Andrew | LIBERAL PARTY | 0882050255 | saliberal.org.au | |
| 2 | BANKS, Alexander | PAULINE HANSON'S ONE NATION | ||||
| 3 | HALE, Dan | AUSTRALIAN FAMILY PARTY | ||||
| 4 | MORGAN, Liam | LEGALISE CANNABIS SOUTH AUSTRALIA PARTY | lcsaparty.org.au | |||
| 5 | SCALZI, James | THE GREENS | ||||
| 6 | AGNESS, James | AUSTRALIAN LABOR PARTY | 0884186700 | sa.alp.org.au | ||
| 7 | ROBERTS, Jacinta | FAMILY FIRST | familyfirstparty.org.au |
How-To-Vote Cards (PDF)
| District | Position | Candidate | Affiliation | Phone | Website | |
| MacKillop | 1 | VIRGO, Jason | PAULINE HANSON'S ONE NATION | |||
| 2 | McBRIDE, Nick* | INDEPENDENT | 0887621211 | nickmcbride.com.au | ||
| 3 | OLSSON, Cathy | THE GREENS | ||||
| 4 | DAY, Joanna | AUSTRALIAN FAMILY PARTY | ||||
| 5 | DAVIES, Steven | INDEPENDENT | 0419035683 | stevendavies.org | ||
| 6 | PIETZSCH, Jonathan | THE NATIONALS | 0429010047 | sanationals.org.au | ||
| 7 | GREEN, Tim | LEGALISE CANNABIS SOUTH AUSTRALIA PARTY | lcsaparty.org.au | |||
| 8 | ROSSER, Rebekah | LIBERAL PARTY | 0882050255 | saliberal.org.au/team/rebekah-rosser | ||
| 9 | BRAES, Mark | AUSTRALIAN LABOR PARTY | 0884186700 | sa.alp.org.au |
How-To-Vote Cards (PDF)

| District | Position | Candidate | Affiliation | Phone | Website | |
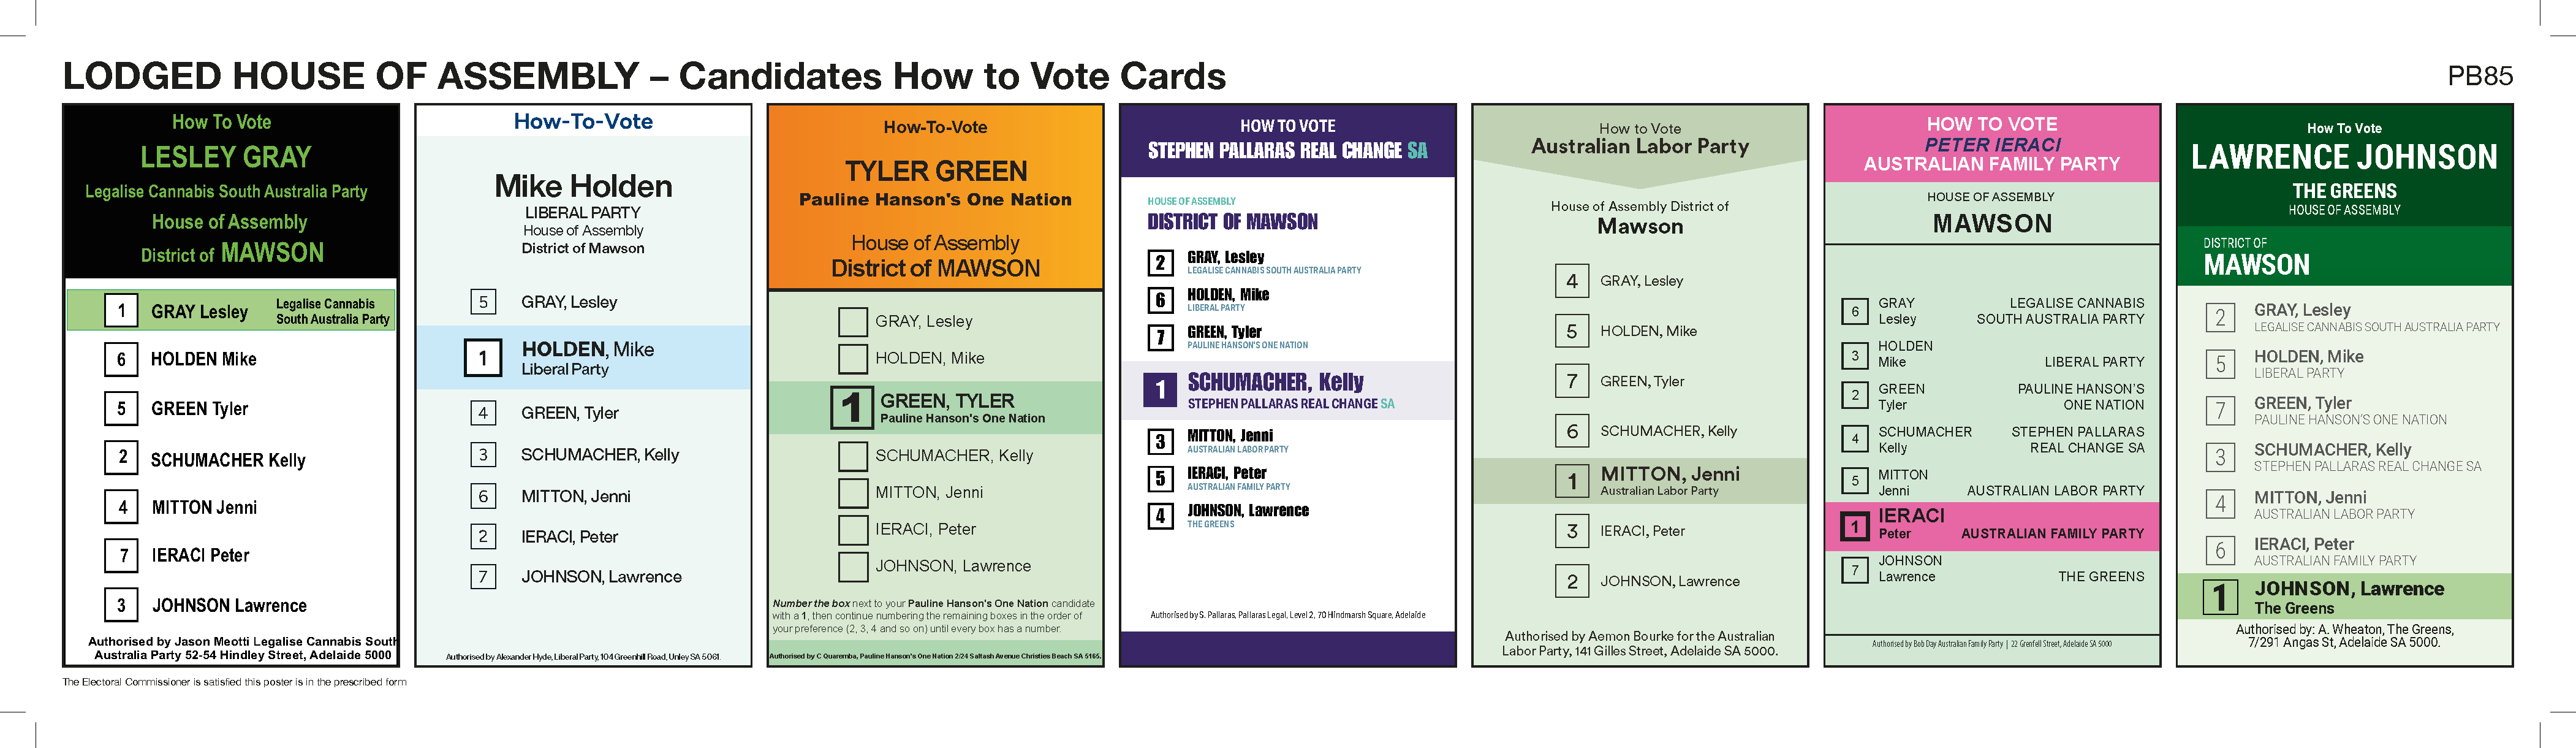
| Mawson | 1 | GRAY, Lesley | LEGALISE CANNABIS SOUTH AUSTRALIA PARTY | lcsaparty.org.au | ||
| 2 | HOLDEN, Mike | LIBERAL PARTY | 0882050255 | |||
| 3 | GREEN, Tyler | PAULINE HANSON'S ONE NATION | ||||
| 4 | SCHUMACHER, Kelly | STEPHEN PALLARAS REAL CHANGE SA | stephenpallaras.com | |||
| 5 | MITTON, Jenni | AUSTRALIAN LABOR PARTY | 0884186700 | sa.alp.org.au | ||
| 6 | IERACI, Peter | AUSTRALIAN FAMILY PARTY | ||||
| 7 | JOHNSON, Lawrence | THE GREENS | 0449972718 |
How-To-Vote Cards (PDF)
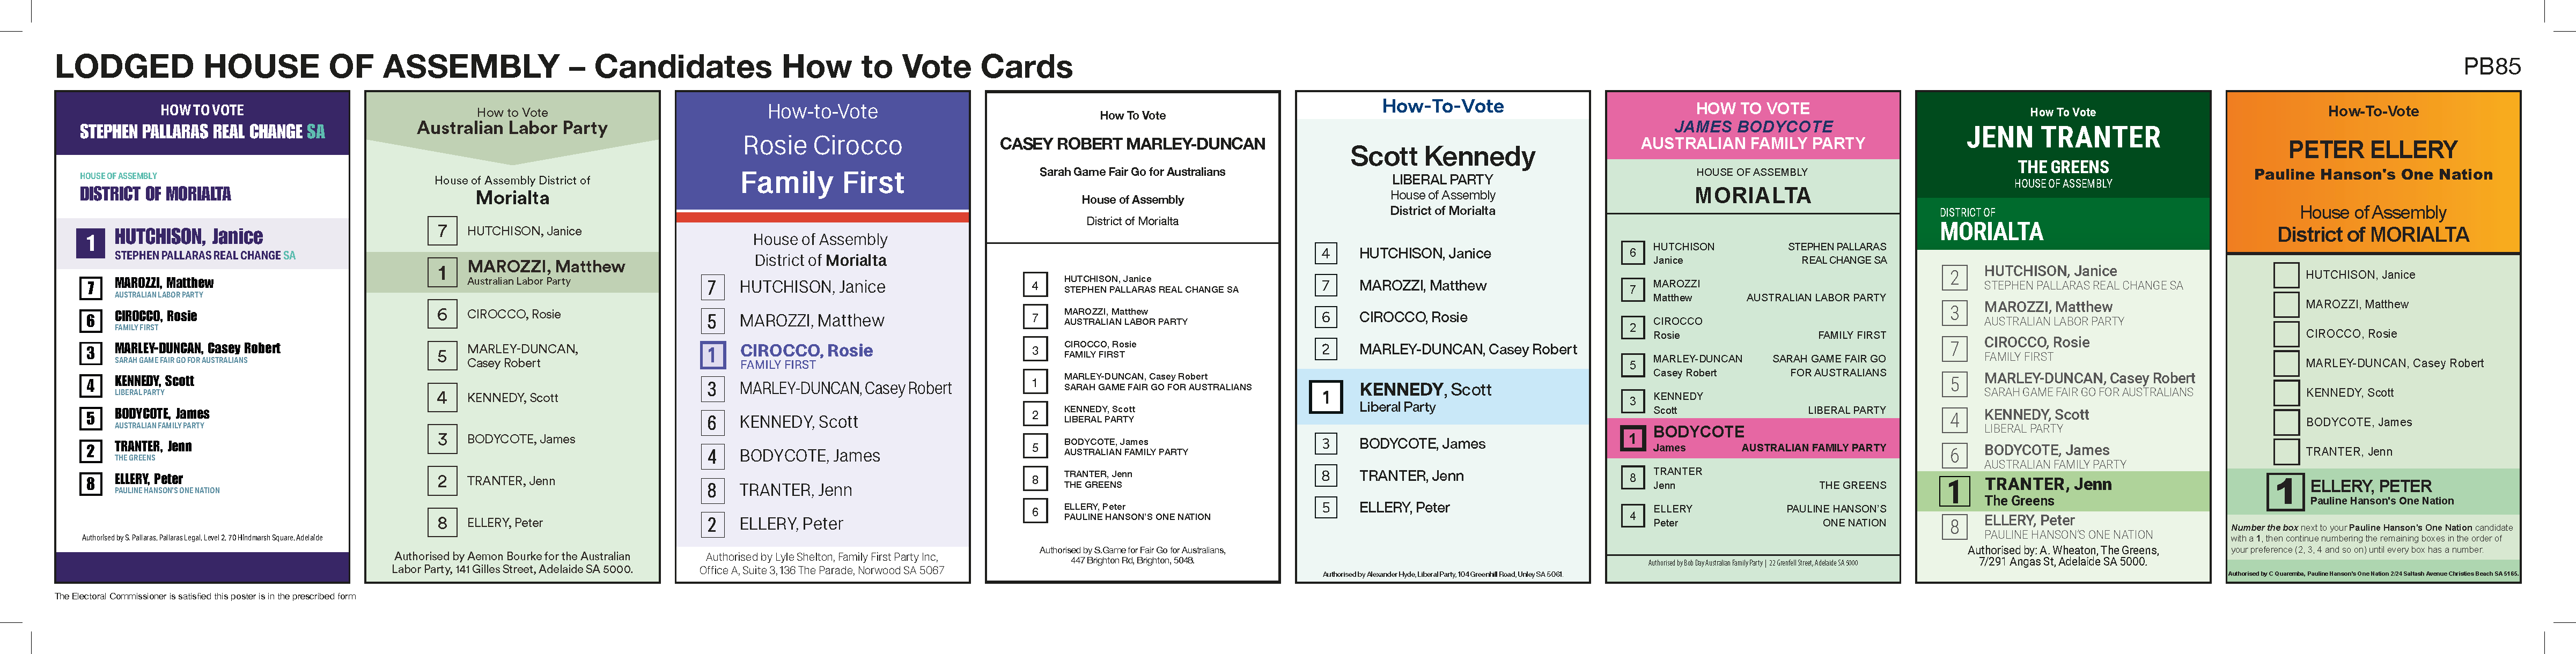
| District | Position | Candidate | Affiliation | Phone | Website | |
| Morialta | 1 | HUTCHISON, Janice | STEPHEN PALLARAS REAL CHANGE SA | stephenpallaras.com | ||
| 2 | MAROZZI, Matthew | AUSTRALIAN LABOR PARTY | ||||
| 3 | CIROCCO, Rosie | FAMILY FIRST | familyfirstparty.org.au | |||
| 4 | MARLEY-DUNCAN, Casey Robert | SARAH GAME FAIR GO FOR AUSTRALIANS | 0418719079 | |||
| 5 | KENNEDY, Scott | LIBERAL PARTY | 0882050255 | saliberal.org.au/team/scott-kennedy | ||
| 6 | BODYCOTE, James | AUSTRALIAN FAMILY PARTY | ||||
| 7 | TRANTER, Jenn | THE GREENS | ||||
| 8 | ELLERY, Peter | PAULINE HANSON'S ONE NATION |
How-To-Vote Cards (PDF)