Elections
| District | Position | Candidate | Affiliation | Phone | Website | |
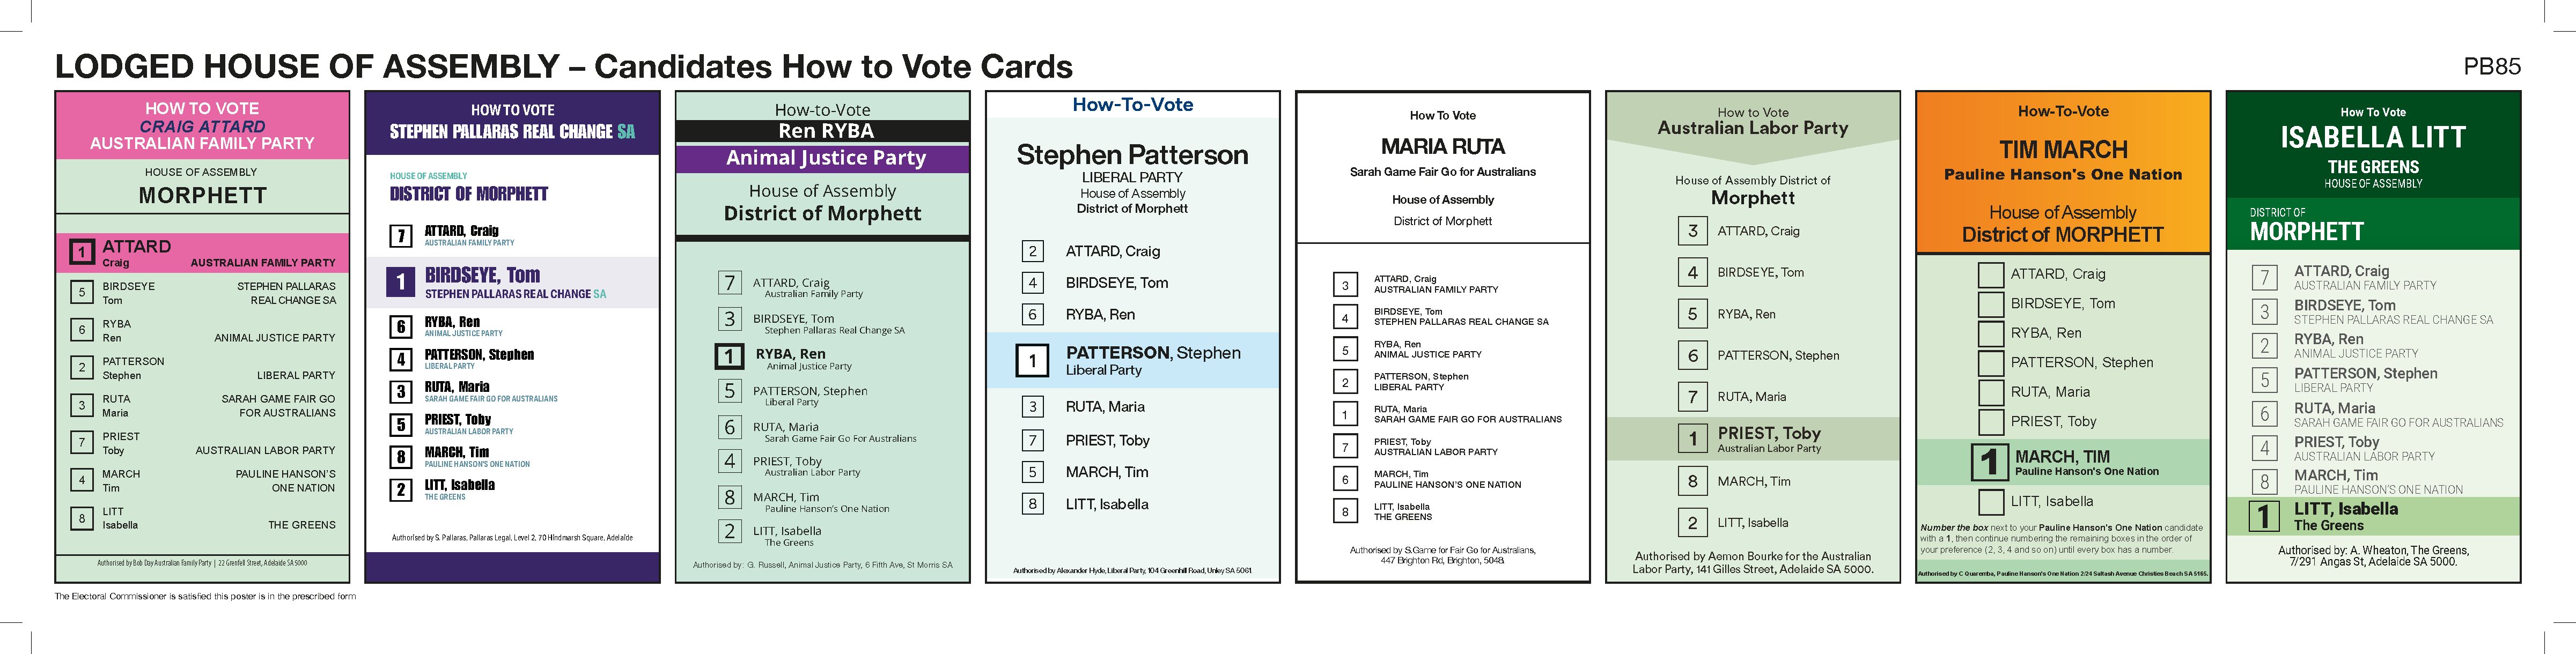
| Morphett | 1 | ATTARD, Craig | AUSTRALIAN FAMILY PARTY | |||
| 2 | BIRDSEYE, Tom | STEPHEN PALLARAS REAL CHANGE SA | stephenpallaras.com | |||
| 3 | RYBA, Ren | ANIMAL JUSTICE PARTY | ||||
| 4 | PATTERSON, Stephen* | LIBERAL PARTY | 0882946711 | stephenpatterson.com.au | ||
| 5 | RUTA, Maria | SARAH GAME FAIR GO FOR AUSTRALIANS | ||||
| 6 | PRIEST, Toby | AUSTRALIAN LABOR PARTY | 0884186700 | sa.alp.org.au | ||
| 7 | MARCH, Tim | PAULINE HANSON'S ONE NATION | ||||
| 8 | LITT, Isabella | THE GREENS |
How-To-Vote Cards (PDF)
| District | Position | Candidate | Affiliation | Phone | Website | |
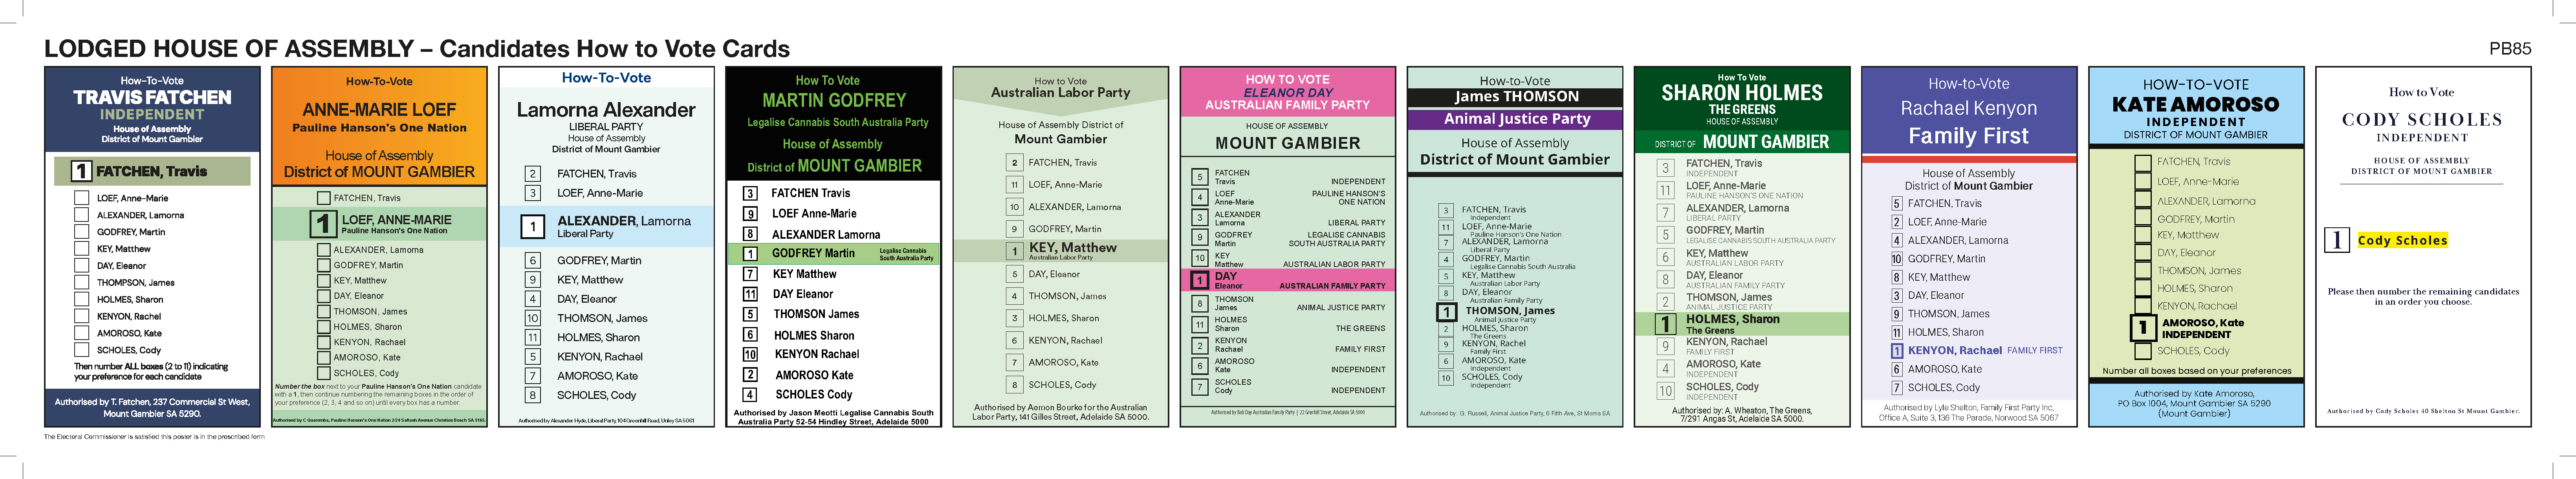
| Mount Gambier | 1 | FATCHEN, Travis | INDEPENDENT | 0459966422 | ||
| 2 | LOEF, Anne-Marie | PAULINE HANSON'S ONE NATION | ||||
| 3 | ALEXANDER, Lamorna | LIBERAL PARTY | 0882050255 | saliberal.org.au/team/lamorna-alexander | ||
| 4 | GODFREY, Martin | LEGALISE CANNABIS SOUTH AUSTRALIA PARTY | www.lcsaparty.org.au/ | |||
| 5 | KEY, Matthew | AUSTRALIAN LABOR PARTY | 0884186700 | sa.alp.org.au | ||
| 6 | DAY, Eleanor | AUSTRALIAN FAMILY PARTY | ||||
| 7 | THOMSON, James | ANIMAL JUSTICE PARTY | ||||
| 8 | HOLMES, Sharon | THE GREENS | 0448892970 | Greens.org.au/sa | ||
| 9 | KENYON, Rachael | FAMILY FIRST | familyfirstparty.org.au | |||
| 10 | AMOROSO, Kate | INDEPENDENT | 0474724626 | |||
| 11 | SCHOLES, Cody | INDEPENDENT | 0418939277 |
How-To-Vote Cards
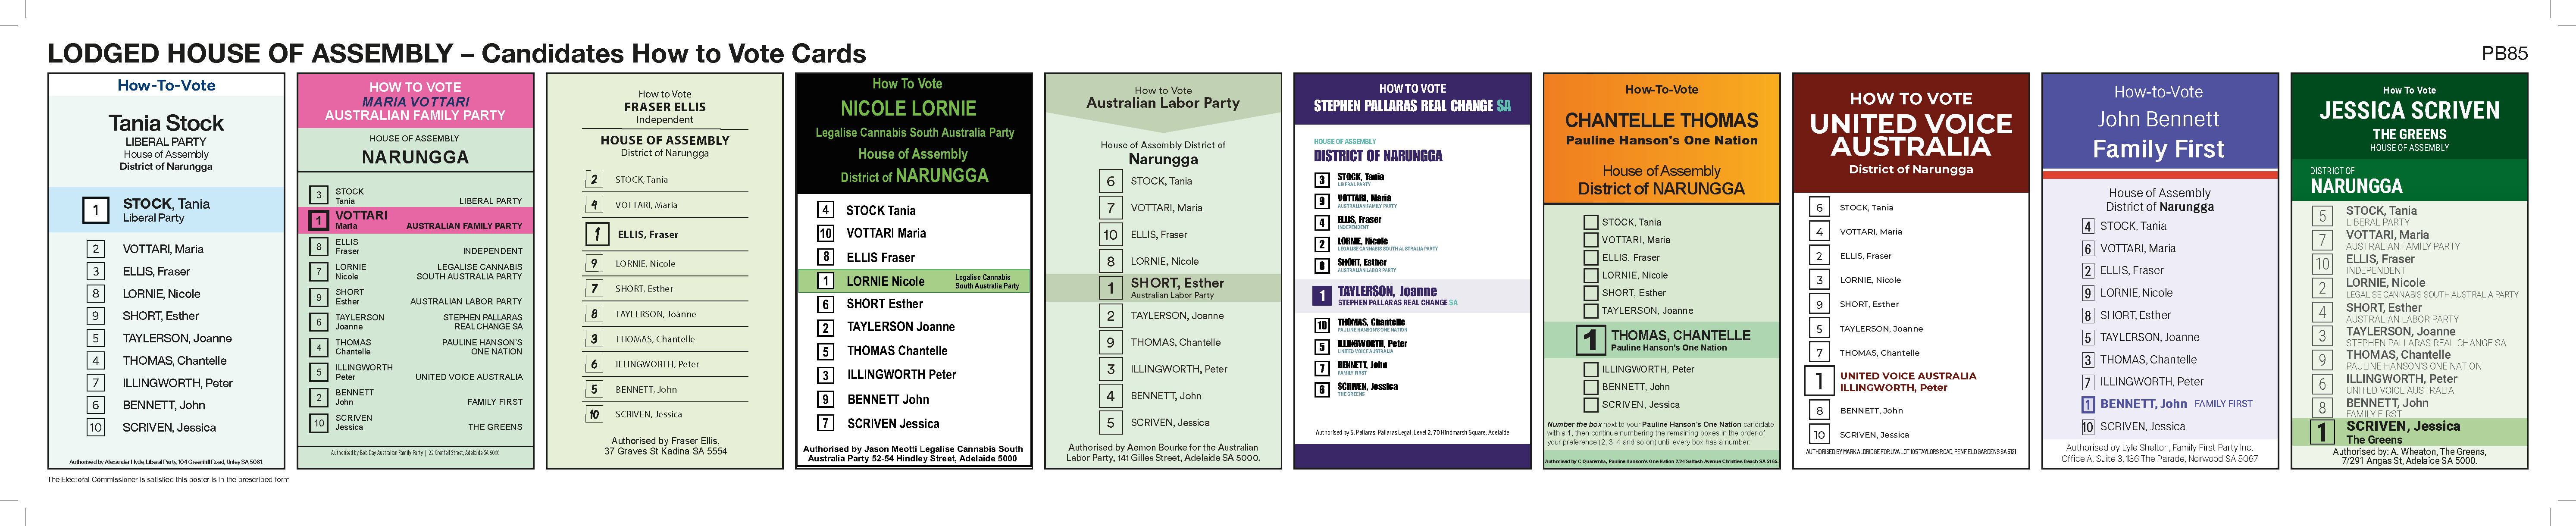
| District | Position | Candidate | Affiliation | Phone | Website | |
| Narungga | 1 | STOCK, Tania | LIBERAL PARTY | 0882050255 | saliberal.org.au/team/tania-stock | |
| 2 | VOTTARI, Maria | AUSTRALIAN FAMILY PARTY | ||||
| 3 | ELLIS, Fraser* | INDEPENDENT | ||||
| 4 | LORNIE, Nicole | LEGALISE CANNABIS SOUTH AUSTRALIA PARTY | lcsaparty.org.au | |||
| 5 | SHORT, Esther | AUSTRALIAN LABOR PARTY | 0884186700 | sa.alp.org.au | ||
| 6 | TAYLERSON, Joanne | STEPHEN PALLARAS REAL CHANGE SA | stephenpallaras.com | |||
| 7 | THOMAS, Chantelle | PAULINE HANSON'S ONE NATION | ||||
| 8 | ILLINGWORTH, Peter | UNITED VOICE AUSTRALIA | 0455539892 | |||
| 9 | BENNETT, John | FAMILY FIRST | familyfirstparty.org.au | |||
| 10 | SCRIVEN, Jessica | THE GREENS |
How-To-Vote Cards (PDF)
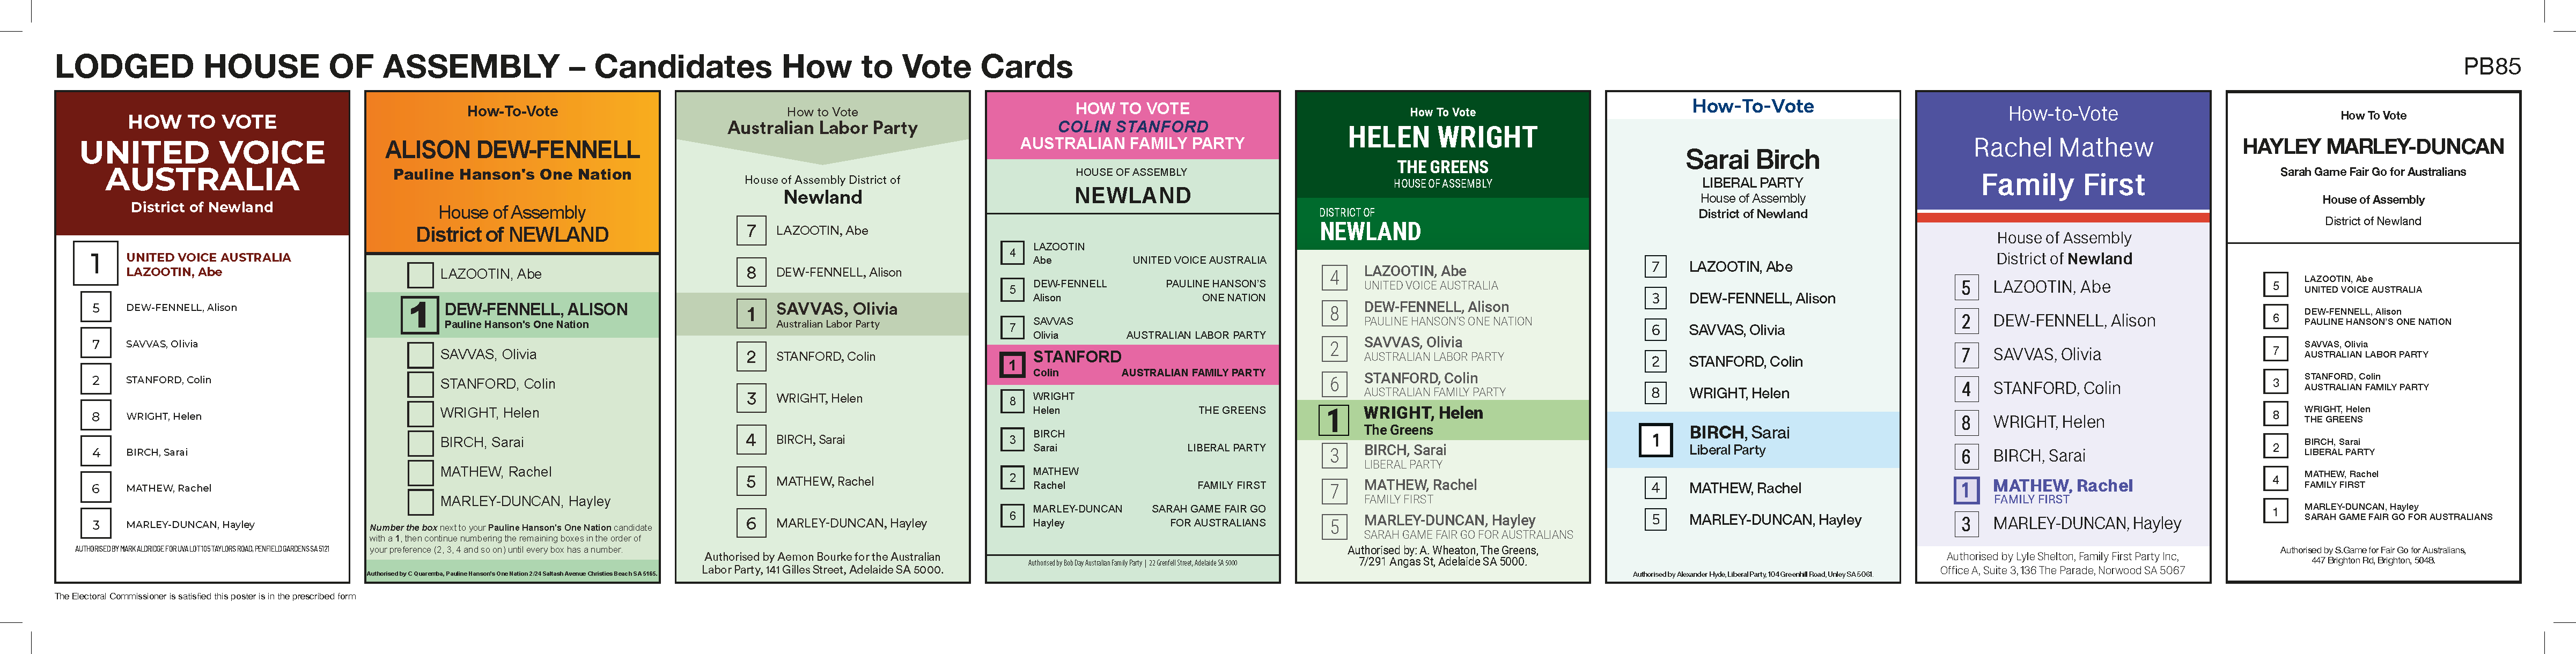
| District | Position | Candidate | Affiliation | Phone | Website | |
| Newland | 1 | LAZOOTIN, Abe | UNITED VOICE AUSTRALIA | 0426221501 | ||
| 2 | DEW-FENNELL, Alison | PAULINE HANSON'S ONE NATION | ||||
| 3 | SAVVAS, Olivia* | AUSTRALIAN LABOR PARTY | 0882644482 | sa.alp.org.au | ||
| 4 | STANFORD, Colin | AUSTRALIAN FAMILY PARTY | ||||
| 5 | WRIGHT, Helen | THE GREENS | ||||
| 6 | BIRCH, Sarai | LIBERAL PARTY | 0882050255 | saliberal.org.au/team/sarai-birch | ||
| 7 | MATHEW, Rachel | FAMILY FIRST | familyfirstparty.org.au | |||
| 8 | MARLEY-DUNCAN, Hayley | SARAH GAME FAIR GO FOR AUSTRALIANS |
How-To-Vote Cards (PDF)