Elections
| District | Position | Candidate | Affiliation | Phone | Website | |
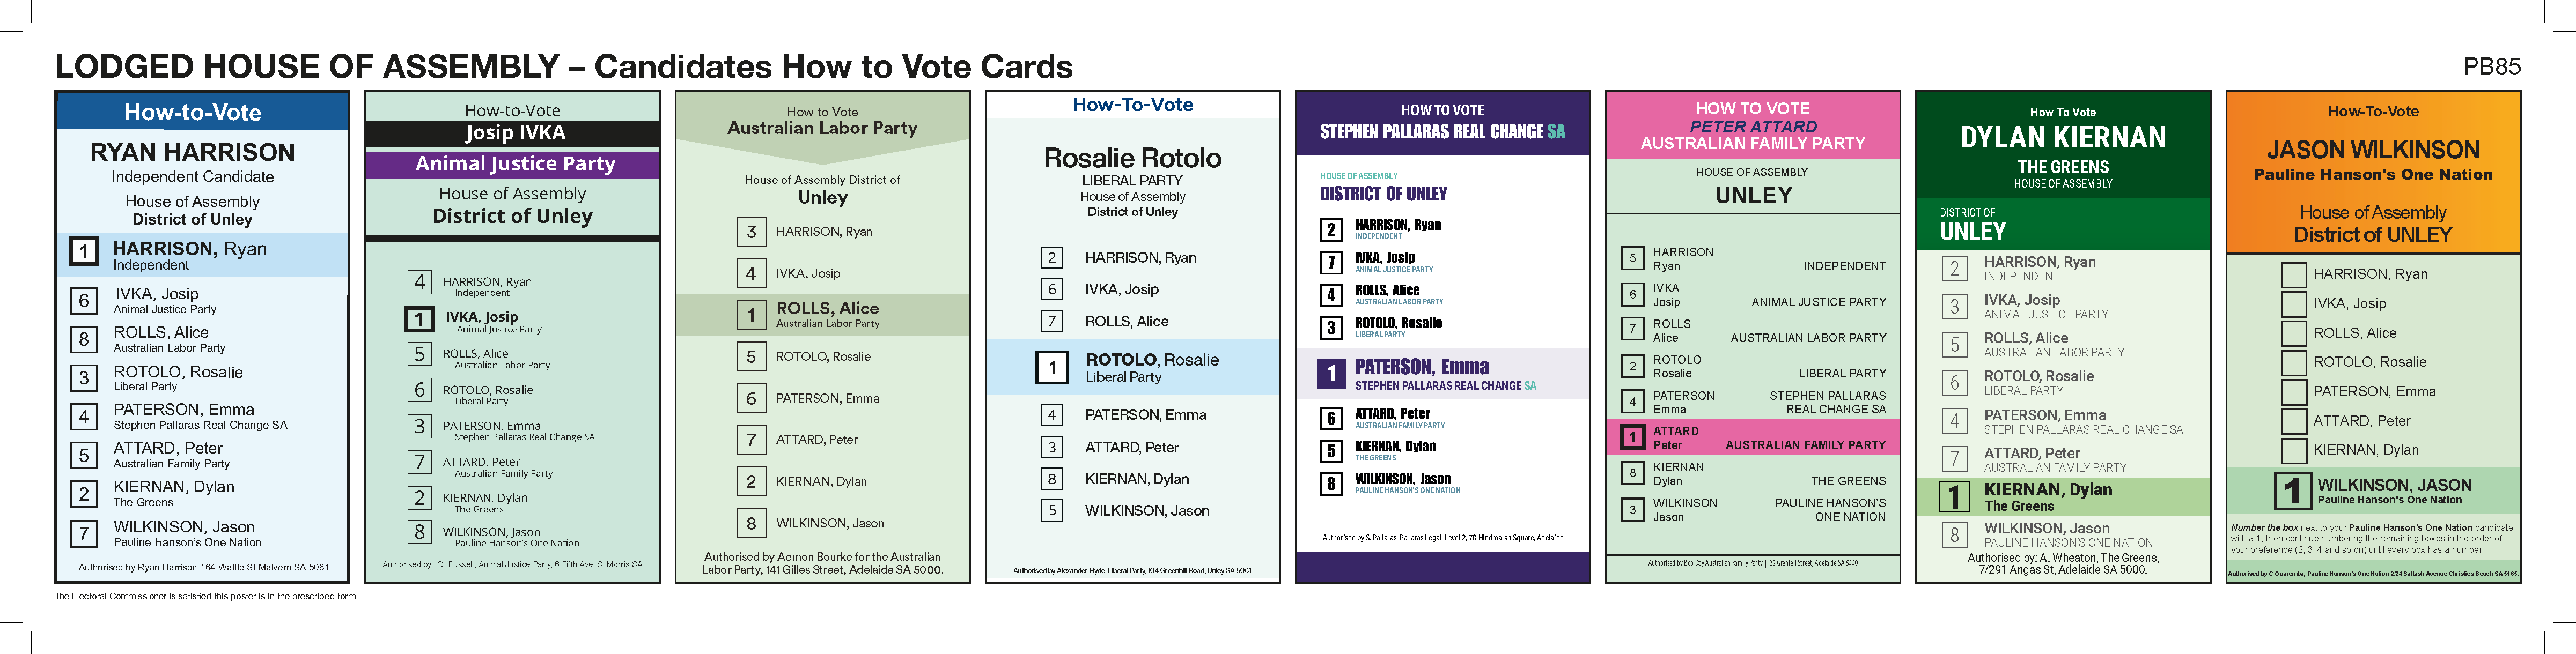
| Unley | 1 | HARRISON, Ryan | INDEPENDENT | 0404910000 | ryanharrison.com.au | |
| 2 | IVKA, Josip | ANIMAL JUSTICE PARTY | ||||
| 3 | ROLLS, Alice | AUSTRALIAN LABOR PARTY | 0884186700 | |||
| 4 | ROTOLO, Rosalie | LIBERAL PARTY | 0882050255 | saliberal.org.au/team/rosalie-rotolo | ||
| 5 | PATERSON, Emma | STEPHEN PALLARAS REAL CHANGE SA | www.stephenpallaras.com | |||
| 6 | ATTARD, Peter | AUSTRALIAN FAMILY PARTY | ||||
| 7 | KIERNAN, Dylan | THE GREENS | ||||
| 8 | WILKINSON, Jason | PAULINE HANSON'S ONE NATION |
How-To-Vote Cards (PDF)
| District | Position | Candidate | Affiliation | Phone | Website | |
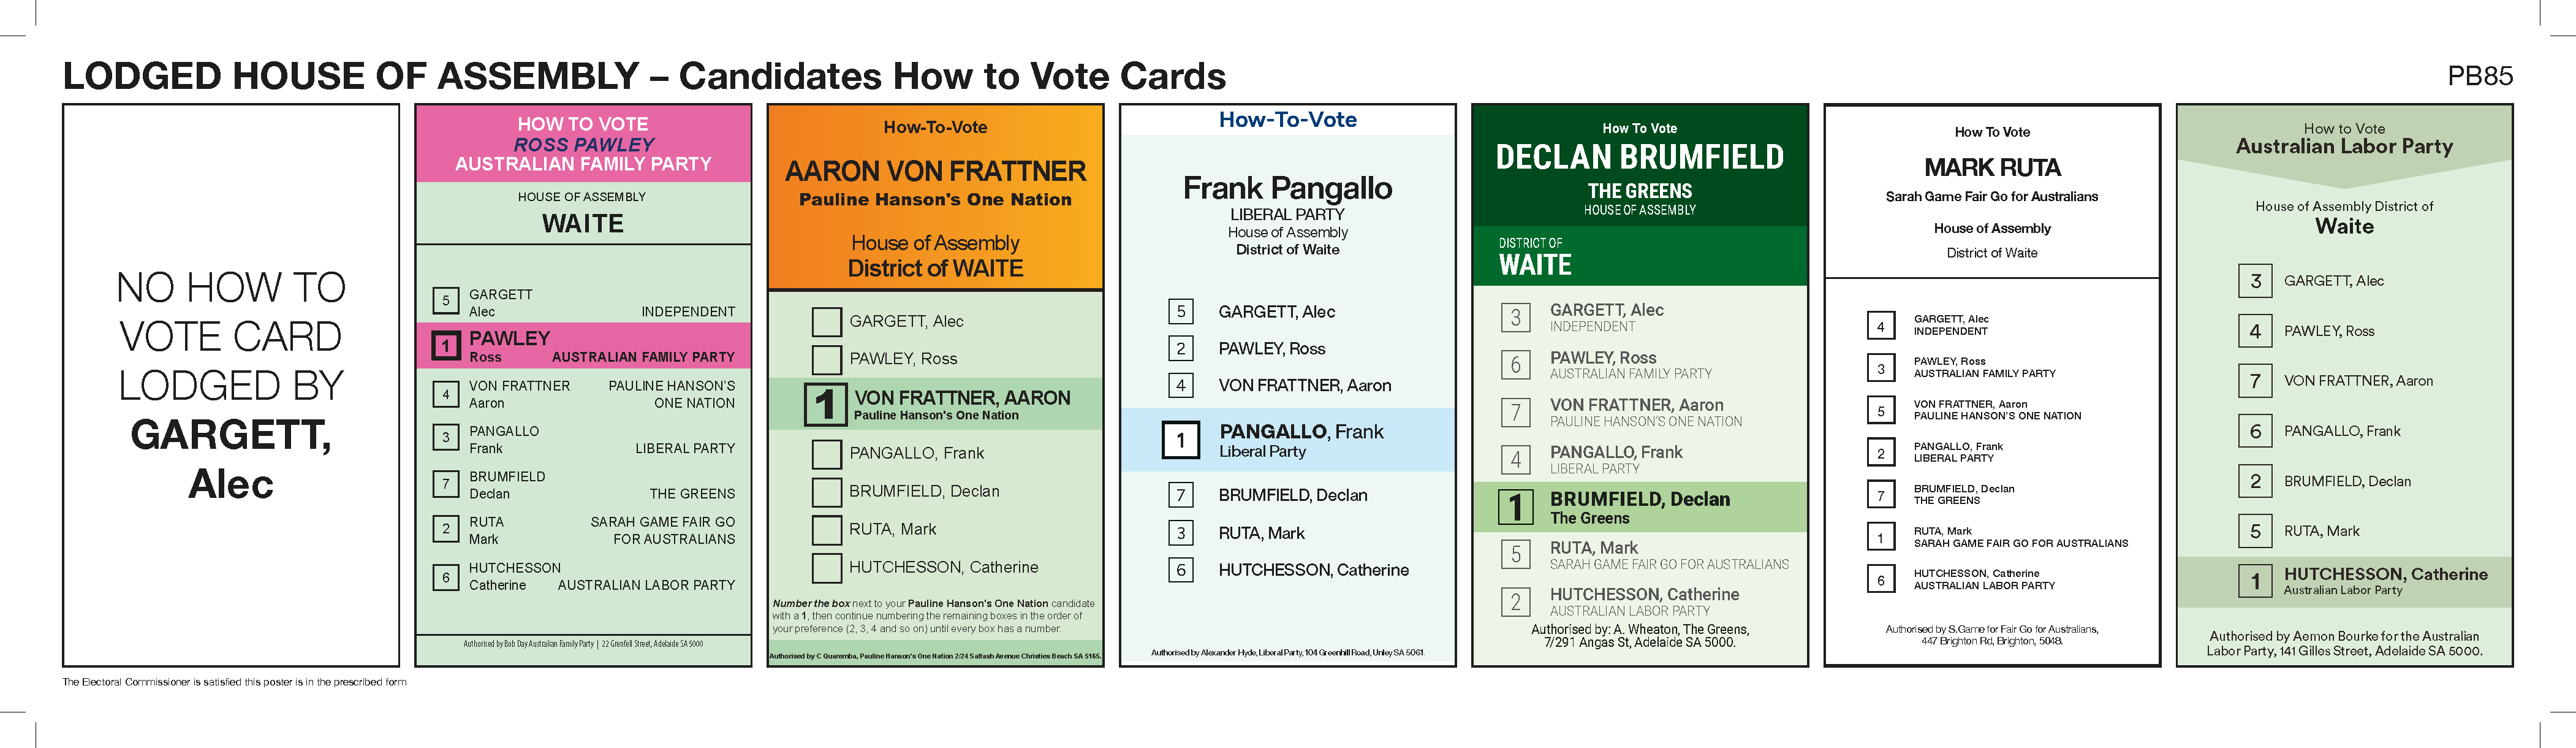
| Waite | 1 | GARGETT, Alec | INDEPENDENT | 0420733540 | alecgargett.net | |
| 2 | PAWLEY, Ross | AUSTRALIAN FAMILY PARTY | ||||
| 3 | VON FRATTNER, Aaron | PAULINE HANSON'S ONE NATION | ||||
| 4 | PANGALLO, Frank† | LIBERAL PARTY | 0882050255 0438777159 |
saliberal.org.au/team/frank-pangallo | ||
| 5 | BRUMFIELD, Declan | THE GREENS | ||||
| 6 | RUTA, Mark | SARAH GAME FAIR GO FOR AUSTRALIANS | ||||
| 7 | HUTCHESSON, Catherine* | AUSTRALIAN LABOR PARTY | 0882785844 | sa.alp.org.au |
*Denotes sitting member
† Denotes sitting member - new district
| District | Position | Candidate | Affiliation | Phone | Website | |
| West Torrens | 1 | KOUTSANTONIS, Tom* | AUSTRALIAN LABOR PARTY | 0882340777 | sa.alp.org.au | |
| 2 | WAMAYI, Anna | FAMILY FIRST | familyfirstparty.org.au | |||
| 3 | ALDRIDGE, Judith | PAULINE HANSON'S ONE NATION | ||||
| 4 | SHARMA, Sarika | LIBERAL PARTY | 0882050255 | saliberal.org.au | ||
| 5 | BANNON, Sam | THE GREENS | ||||
| 6 | WILSON, Mathew | AUSTRALIAN FAMILY PARTY |
*Denotes sitting member
How-To-Vote Cards (PDF)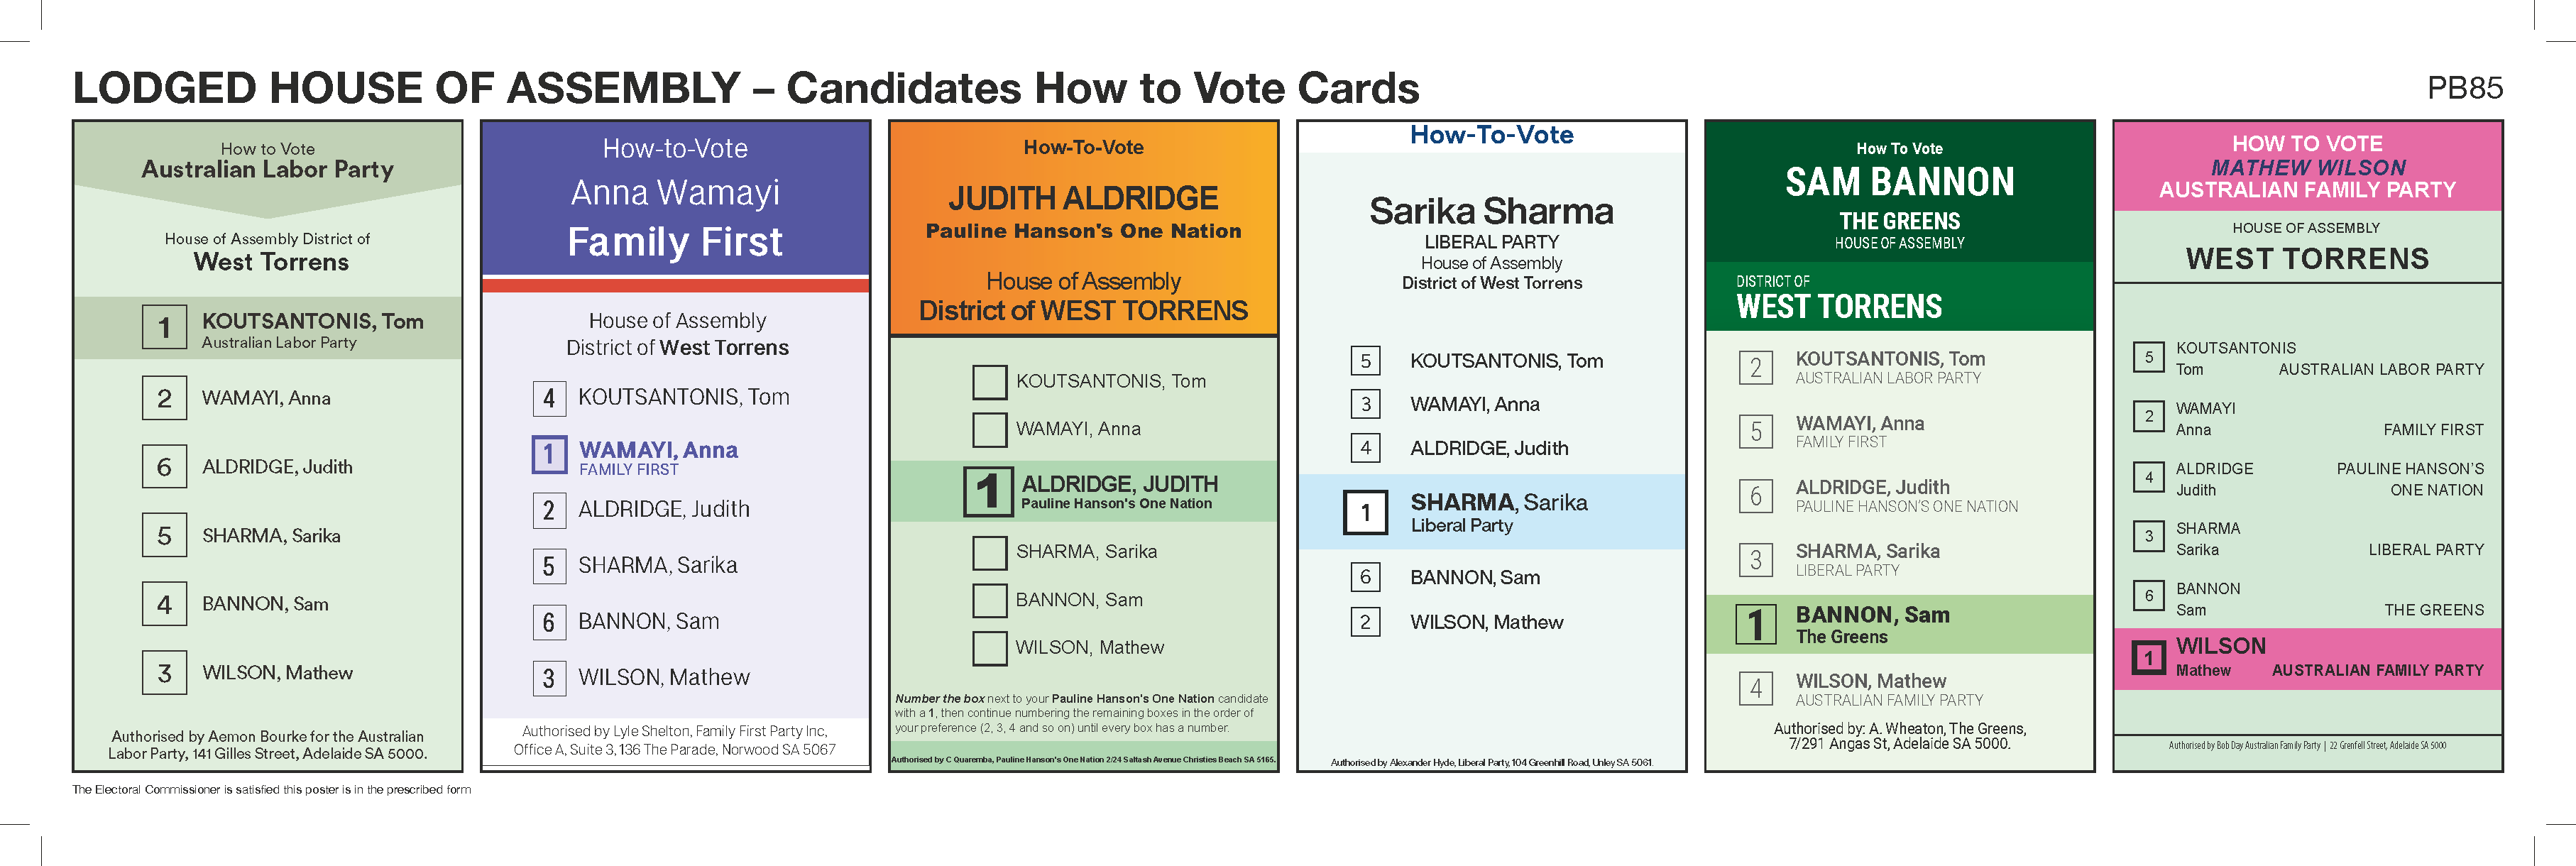
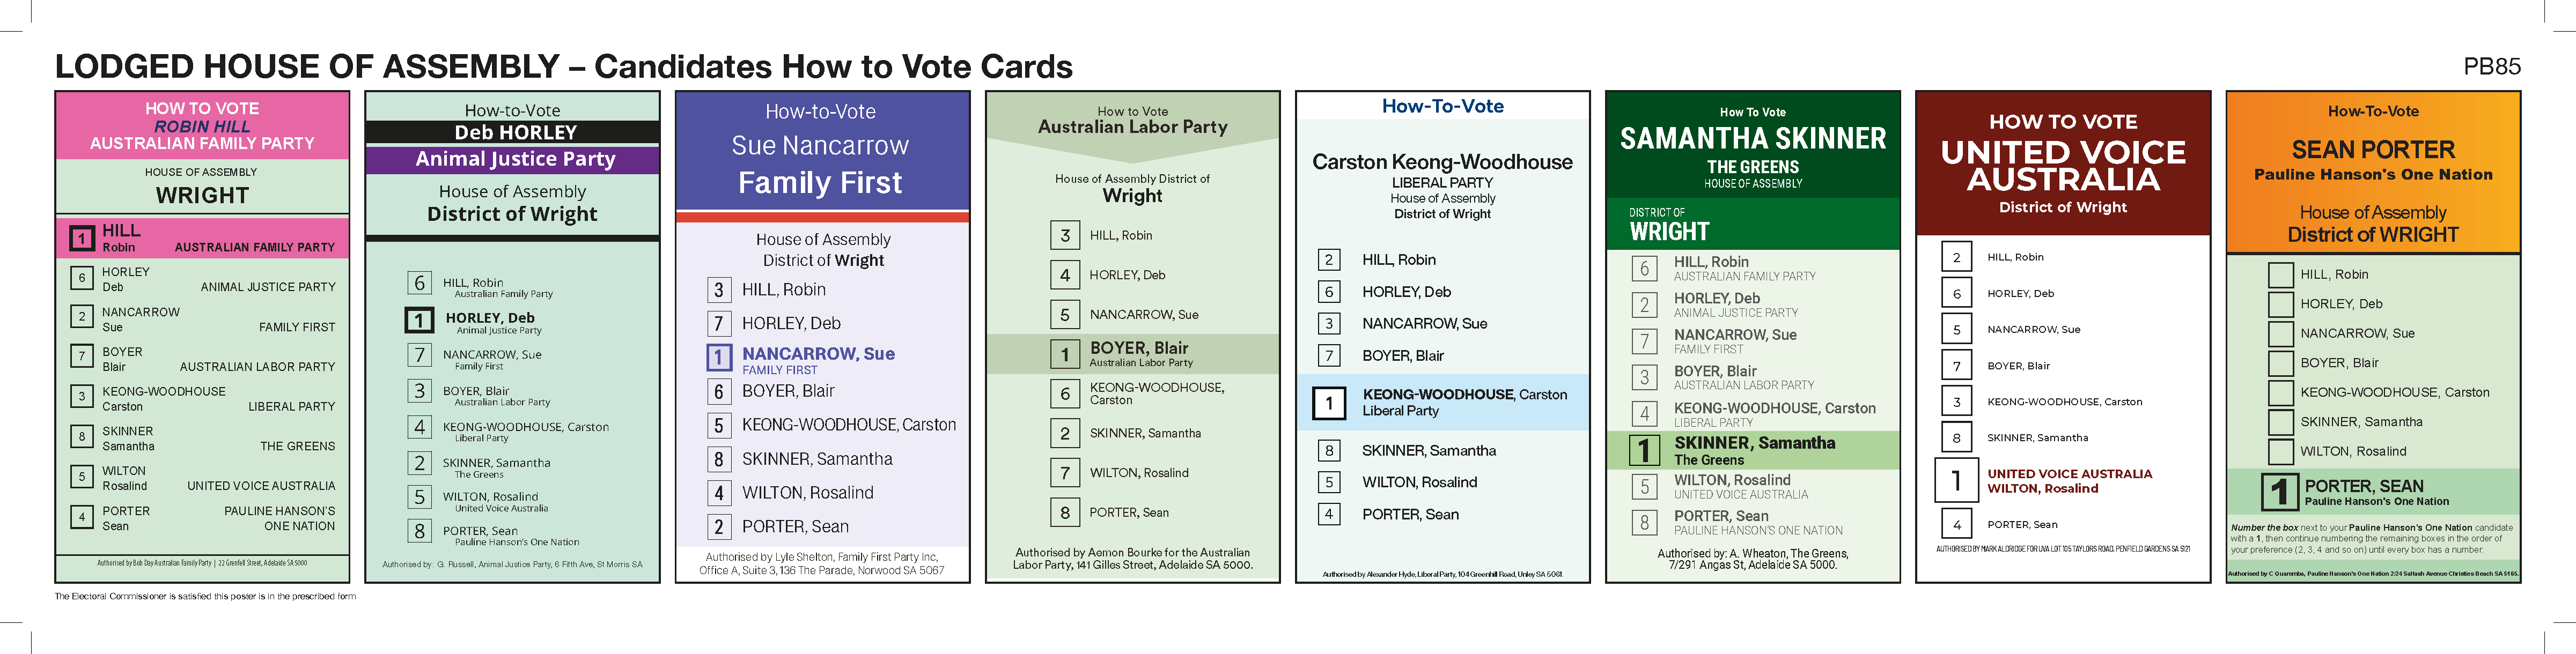
| District | Position | Candidate | Affiliation | Phone | Website | |
| Wright | 1 | HILL, Robin | AUSTRALIAN FAMILY PARTY | |||
| 2 | HORLEY, Deb | ANIMAL JUSTICE PARTY | ||||
| 3 | NANCARROW, Sue | FAMILY FIRST | familyfirstparty.org.au | |||
| 4 | BOYER, Blair* | AUSTRALIAN LABOR PARTY | 0882890700 | sa.alp.org.au | ||
| 5 | KEONG-WOODHOUSE, Carston | LIBERAL PARTY | 0882050255 | saliberal.org.au | ||
| 6 | SKINNER, Samantha | THE GREENS | ||||
| 7 | WILTON, Rosalind | UNITED VOICE AUSTRALIA | ||||
| 8 | PORTER, Sean | PAULINE HANSON'S ONE NATION |
How-To-Vote Cards (PDF)