Elections
Make your mark. Council elections are your opportunity to represent your community.
As a council member, you can help create a future that you and your community can be proud of and enjoy. If you are passionate about your local community, willing to work as part of a team, keen to learn and make a difference, nominate for a position on council.
In South Australia, whole of state council elections (called periodic elections) are held every 4 years for all 68 councils except the Municipal Council of Roxby Downs, which operates under its own administration.
The next periodic council elections will take place in November 2026.
If an elected position on a council becomes vacant between periodic elections, ECSA may conduct a supplementary election. A vacancy can occur due to death, illness, resignation, or any other circumstances according to the Local Government (Elections) Act 1999.
Further information
Acts and RegulationsThe rules that govern council elections are set out in:
The Acts and Regulations should be read in conjunction with the Local Government Act 1999.
Candidate eligibility and ineligibilityYou are eligible to be a candidate for election as a member of a council if you are:
- an Australian citizen
- at the time the electoral roll closes:
- enrolled in the council area you are contesting, or
- the nominee of a body corporate or a group that has its name on the voters roll for the council area
- left off the voters roll for the council area in error.
You are not eligible to be a candidate for election as a member of a council if you are:
- a member of an Australian Parliament; or
- an undischarged bankrupt or receiving the benefit of a law for the relief of insolvent debtors; or
- have been sentenced to imprisonment and are, or could on the happening of some contingency become, liable to serve the sentence or the remainder of the sentence; or
- are an employee of the council; or
- are disqualified from election by court order under the Local Government Act 1999.
You are not eligible to be a candidate for election as a member of a council if you:
- in the case of a supplementary election - are a member of another council; or
- in the case of any election - are a candidate for election as a member of another council
A person who is a candidate for election to an office of a council must lodge the following returns with the Electoral Commissioner:
- A candidate in a Local Government Election, you are required to lodge two campaign donation returns at the times prescribed by the Local Government (Elections) Act 1999
- A candidate that receives a gift valued at more than $2,500 (or gifts totalling $2,500 from the same donor) must submit a large gift return within 5 days of receipt of that gift
More information about candidate disclosure returns for recent elections can be accessed via the candidate returns for council elections page.
Candidate responsibilitiesAs a candidate, you have a range of important responsibilities and obligations under the law. These include making sure all electoral material you publish contains the proper authorisation statement, and that the material is not inaccurate and misleading.
View the electoral advertising page for more information.
All candidates, whether successful or not, must lodge disclosure returns. Read more on our candidate returns for council elections page.
Electoral advertisingThere are restrictions placed on advertising during, and outside of, an election period. These are contained within Part 7 of the Local Government (Elections) Act 1999. The Electoral Commission SA is unable to provide advice on the interpretation of these provisions. Therefore, if you are in doubt about the interpretation, we recommend you seek independent legal advice.
Learn more on our electoral advertising page.
Forms and handbooks- Campaign donation return LG2 (PDF, 829KB)
- Candidate Handbook (PDF)
- Large gifts return LG52 (PDF, 232KB)
- Profile and photograph requirements LG13 (PDF, 735KB)
- Scrutineer authority LG15 - (PDF, 258KB)
- Scrutineer guide LG14 - (PDF, 528KB)
- Understanding the role of a councillor (PDF, 2.4MB)
- Voters roll - Acknowledgment of use LG55 (PDF, 236KB)
Councils are responsible for many of the services that make South Australia such a great place to live and work, including libraries, playgrounds, sporting facilities and rubbish and recycling.
Becoming a councillor or mayor means you will help shape a wide range of policies and decisions that will impact the short and long-term future of your local community.
More information can be found on the council elections website (this link goes to an external website).
Sample Ballot Paper (PDF)
How-To-Vote Cards (PDF)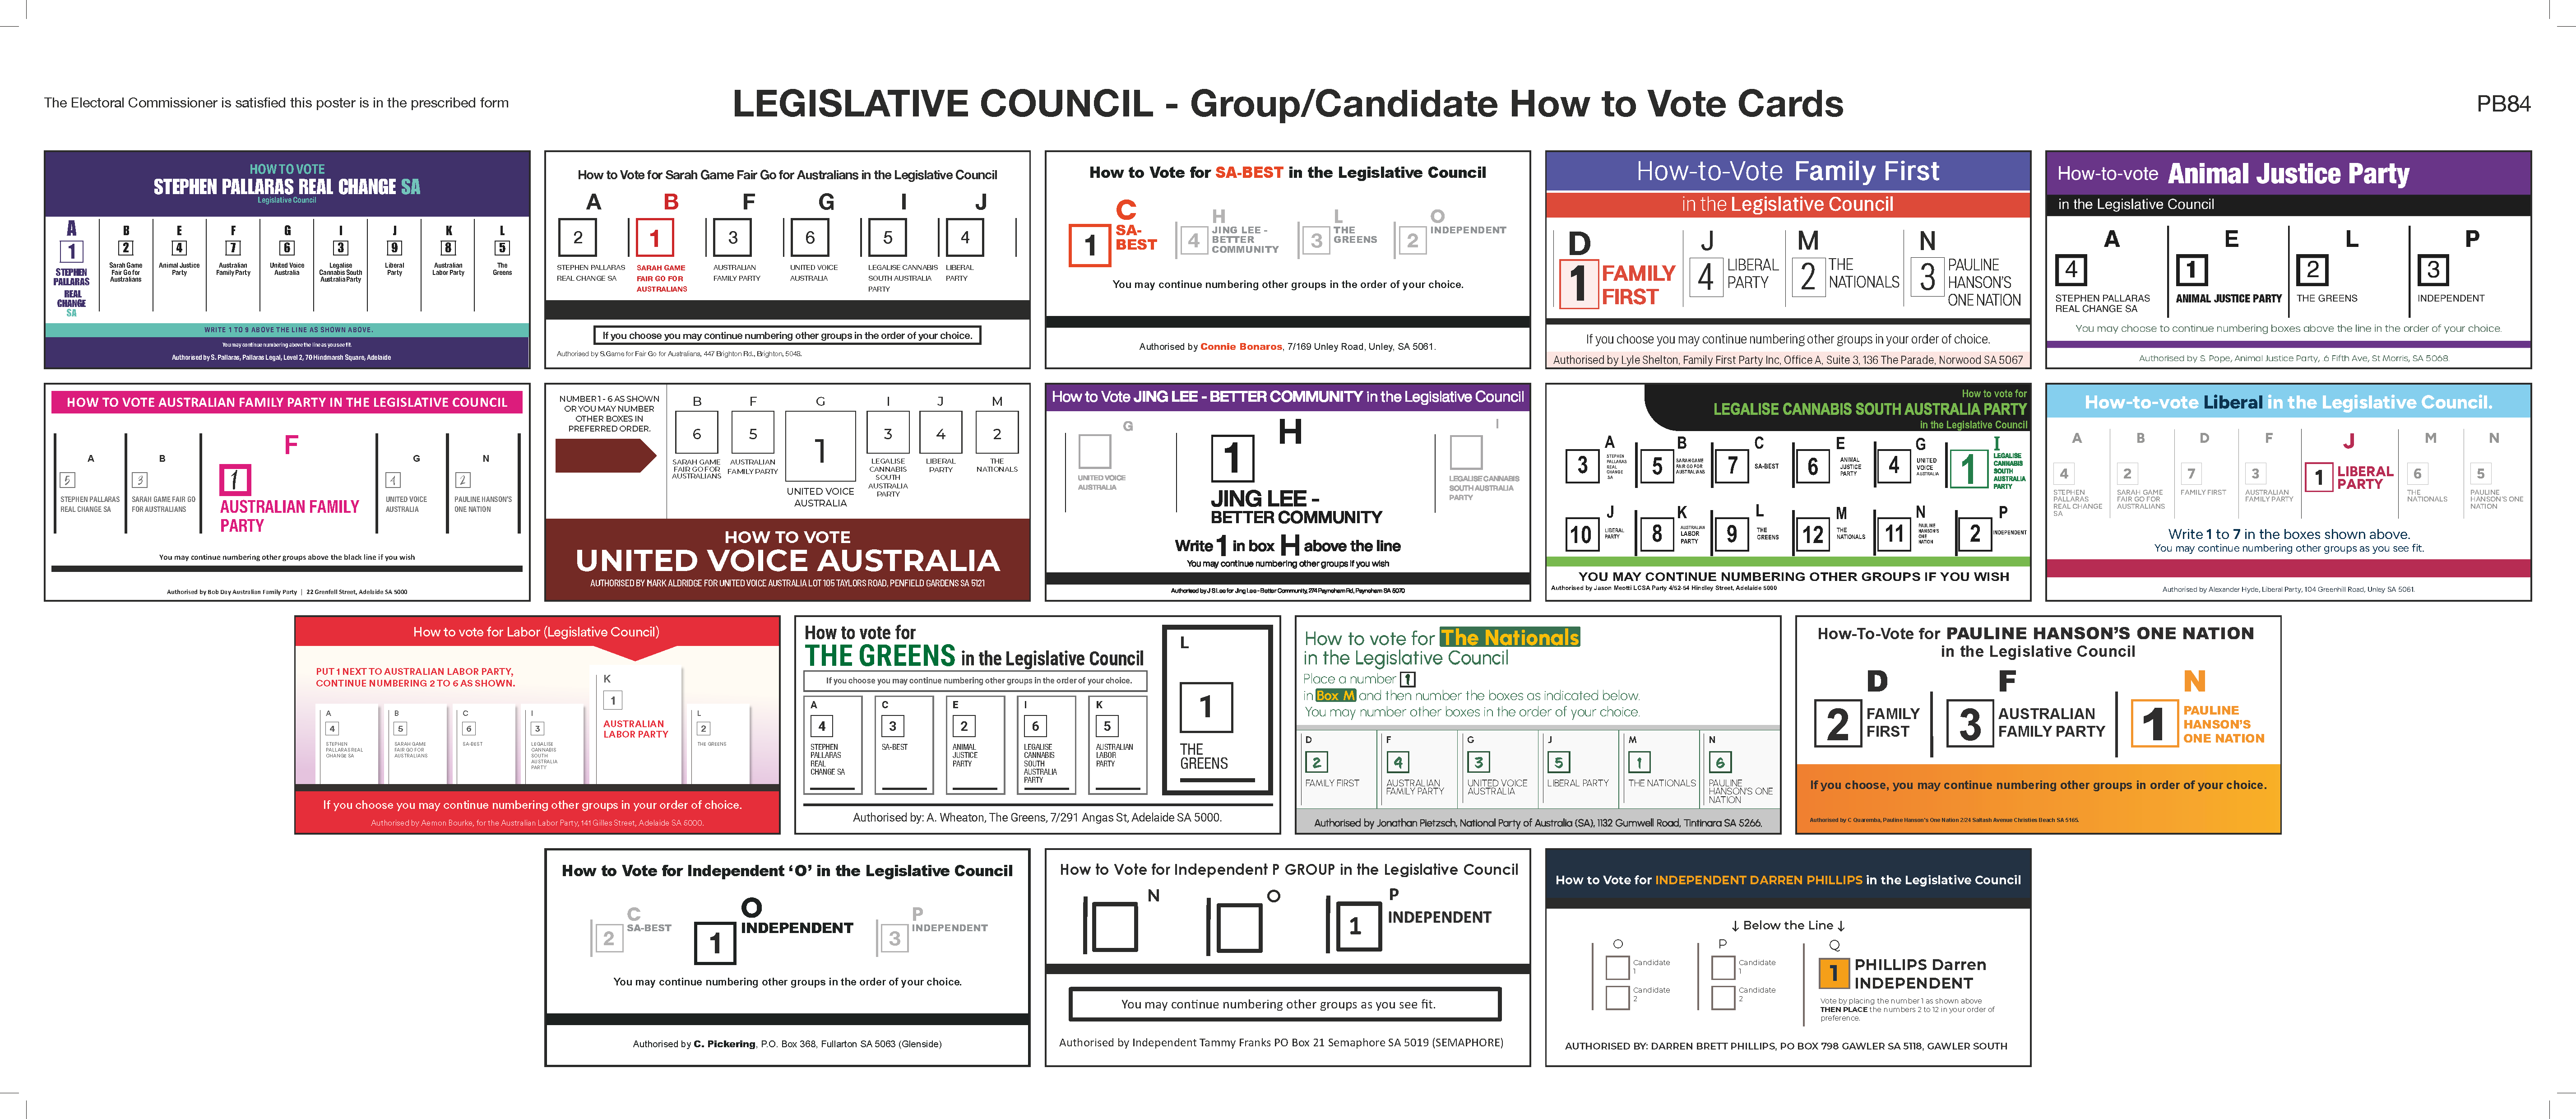
Candidates
| Ballot Paper Column | Ballot Paper Name | Affiliation on Ballot Paper | Position |
| A | PALLARAS, Stephen | STEPHEN PALLARAS REAL CHANGE SA | 1 |
| A | PALLARAS, Daniel | STEPHEN PALLARAS REAL CHANGE SA | 2 |
| B | McDERMOTT, Chris | Sarah Game Fair Go for Australians | 1 |
| B | FOOTE, Shannon | Sarah Game Fair Go for Australians | 2 |
| C | BONAROS, Connie * | SA-BEST | 1 |
| C | BARRETT, Skye | SA-BEST | 2 |
| C | ROWE, Joanna | SA-BEST | 3 |
| C | BANELIS, John | SA-BEST | 4 |
| C | DEWAR, Naomi | SA-BEST | 5 |
| D | MATHEW, Deepa | Family First | 1 |
| D | BROHIER, Christopher | Family First | 2 |
| E | PENGILLEY, Lionel | Animal Justice Party | 1 |
| E | RUSSELL, Geoff | Animal Justice Party | 2 |
| F | DAY, Bob | Australian Family Party | 1 |
| F | HUSSEY, Nicole | Australian Family Party | 2 |
| F | DAY, John | Australian Family Party | 3 |
| G | ALDRIDGE, Mark | United Voice Australia | 1 |
| G | BAWDEN, Matilda | United Voice Australia | 2 |
| H | LEE, Jing * | Jing Lee - Better Community | 1 |
| H | CAIAZZA, Danny | Jing Lee - Better Community | 2 |
| I | NIES, Jessica | Legalise Cannabis South Australia Party | 1 |
| I | WATERS, Peter | Legalise Cannabis South Australia Party | 2 |
| J | HOOD, Ben * | Liberal Party | 1 |
| J | GIROLAMO, Heidi * | Liberal Party | 2 |
| J | MUMFORD, Rowan | Liberal Party | 3 |
| J | SINGH, KD | Liberal Party | 4 |
| J | CRAWFORD-MARSHALL, Belinda | Liberal Party | 5 |
| K | BOURKE, Emily * | Australian Labor Party | 1 |
| K | EL DANNAWI, Mira * | Australian Labor Party | 2 |
| K | HANSON, Justin * | Australian Labor Party | 3 |
| K | GUMBYS, Hilton | Australian Labor Party | 4 |
| K | SCRIVEN, Clare * | Australian Labor Party | 5 |
| K | CHIDAMBARANATHAN, Senthil | Australian Labor Party | 6 |
| K | DENG, Awur | Australian Labor Party | 7 |
| L | SELWOOD, Melanie | The Greens | 1 |
| L | McCUSKER, Katie | The Greens | 2 |
| L | SMITH, Christopher Gordon | The Greens | 3 |
| M | LAMBERT, Rikki | The Nationals | 1 |
| M | RENNIE, Perrin | The Nationals | 2 |
| N | BERNARDI, Cory | Pauline Hanson's One Nation | 1 |
| N | QUAREMBA, Carlos | Pauline Hanson's One Nation | 2 |
| N | HEWETT, Rebecca | Pauline Hanson's One Nation | 3 |
| N | SKRLJ, Nathan | Pauline Hanson's One Nation | 4 |
| O | PICKERING, Craig | Independent | 1 |
| O | HUTCHINSON, Emily | Independent | 2 |
| P | FRANKS, Tammy * | Independent | 1 |
| P | COLEMAN, Faith | Independent | 2 |
| Q | PHILLIPS, Darren | Independent | 1 |
Return to Election Information
Legislative Council
The returning officer for the Legislative Council is:
Name: Dr Daniel Marx
Phone: 08 8429 0579
Email:
Address: Level 6, 60 Light Square, Adelaide
House of Assembly
The returning officer for each district is listed below:
| DISTRICT | RO Name | Phone | Street | Suburb | State | Postcode | |
| ADELAIDE | Roy Bushaway | 08 7323 7650 | 300 Richmond Rd | Netley | SA | 5037 | |
| BADCOE | Carolyn Pyatt | 08 7323 7651 | 300 Richmond Rd | Netley | SA | 5037 | |
| BLACK | Anne Rhodes | 08 7323 7652 | 54 Burgess St | Noarlunga Centre | SA | 5168 | |
| BRAGG | Annette Tonissen | 08 7323 7653 | 15-31 Ayliffes Rd | St Marys | SA | 5042 | |
| CHAFFEY | Sharon Schrapel | 08 7323 7654 | 52 Field Day Dr | Barmera | SA | 5345 | |
| CHELTENHAM | Calvin Dee | 08 7323 7655 | 308 St Vincent St | Port Adelaide | SA | 5015 | |
| COLTON | Deb Borkowski- Uphill | 08 7323 7656 | 300 Richmond Rd | Netley | SA | 5037 | |
| CROYDON | Mario Vitagliano | 08 7323 7657 | 513 Grand Junction Rd | Wingfield | SA | 5013 | |
| DAVENPORT | Anthony Thomas | 08 7323 7658 | 15-31 Ayliffes Rd | St Marys | SA | 5042 | |
| DUNSTAN | Wayne Turner | 08 7323 7659 | 41 Beulah Rd | Norwood | SA | 5067 | |
| ELDER | Emma Griffin | 08 7323 7660 | 300 Richmond Rd | Netley | SA | 5037 | |
| ELIZABETH | Sandy Gladdis | 08 7323 7661 | 485 Main North Rd | Evanston | SA | 5116 | |
| ENFIELD | Henry Sloniec | 08 7323 7662 | 33-37 Port Wakefield Rd | Gepps Cross | SA | 5094 | |
| FINNISS | Sandy Spencer | 08 7323 7663 | 24 & 24A North Tce | Port Elliot | SA | 5215 | |
| FLINDERS | Vicki Seidel | 08 7323 7664 | 16-18 Hallett Pl | Port Lincoln | SA | 5606 | |
| FLOREY | Trish Marshall | 08 7323 7665 | 33-37 Port Wakefield Rd | Gepps Cross | SA | 5094 | |
| GIBSON | Cobie Sinclair | 08 7323 7666 | 300 Richmond Rd | Netley | SA | 5037 | |
| GILES | Robert Genahl | 08 7323 7667 | 21 Grundel St | Whyalla Norrie | SA | 5608 | |
| HAMMOND | Ken Coventry | 08 7323 7668 | 28 Bridge St | Murrary Bridge | SA | 5253 | |
| HARTLEY | Greg Wright | 08 7323 7669 | 2 Turner St | Felixstow | SA | 5070 | |
| HEYSEN | Michelle Judd | 08 7323 7670 | 23 Adelaide Rd | Echunga | SA | 5153 | |
| HURTLE VALE | Terry Ellis | 08 7323 7671 | 54 Burgess St | Noarlunga Centre | SA | 5168 | |
| KAURNA | David Hitchcock | 08 7323 7672 | 54 Burgess St | Noarlunga Centre | SA | 5168 | |
| KAVEL | Andrew Fort | 08 7323 7673 | 23 Adelaide Rd | Echunga | SA | 5153 | |
| KING | Brian Hemming | 08 7323 7674 | 33-37 Port Wakefield Rd | Gepps Cross | SA | 5094 | |
| LEE | Anna Allard | 08 7323 7754 | 308 St Vincent St | Port Adelaide | SA | 5015 | |
| LIGHT | John Arnold | 08 7323 7675 | 485 Main North Rd | Evanston | SA | 5116 | |
| MACKILLOP | Karen Johnstone | 08 7323 7676 | 148 Racecourse Rd | Bordertown | SA | 5268 | |
| MAWSON | Adrian Kemp | 08 7323 7677 | 54 Burgess St | Noarlunga Centre | SA | 5168 | |
| MORIALTA | Gerry Butler | 08 7323 7678 | 33-37 Port Wakefield Rd | Gepps Cross | SA | 5094 | |
| MORPHETT | Tania Poole | 08 7323 7679 | 15-31 Ayliffes Rd | St Marys | SA | 5042 | |
| MOUNT GAMBIER | Simon Kennett | 08 7323 7680 | 27-29 Commercial St West | Mount Gambier | SA | 5290 | |
| NARUNGGA | Wendy O'Sullivan | 08 7323 7681 | 5/36 Graves St | Kadina | SA | 5554 | |
| NEWLAND | Sandra Lowe | 08 7323 7682 | 33-37 Port Wakefield Rd | Gepps Cross | SA | 5094 | |
| NGADJURI (FROME) | Garry Davies | 08 7323 7683 | 155 Horrocks Hwy | Clare | SA | 5453 | |
| PLAYFORD | David Harris | 08 7323 7684 | 33-37 Port Wakefield Rd | Gepps Cross | SA | 5094 | |
| PORT ADELAIDE | Greg Borg | 08 7323 7685 | 3/171 Commercial Rd | Port Adelaide | SA | 5015 | |
| RAMSAY | Brian Skelly | 08 7323 7686 | 33-37 Port Wakefield Rd | Gepps Cross | SA | 5094 | |
| REYNELL | Tosha Bottroff | 08 7323 7687 | 54 Burgess St | Noarlunga Centre | SA | 5168 | |
| SCHUBERT | Heather Bitter | 08 7323 7688 | 1221 Barossa Valley Way | Lyndoch | SA | 5351 | |
| STUART | Roger Moroney | 08 7323 7689 | 68 Commercial Rd | Port Augusta | SA | 5700 | |
| TAYLOR | Nerida Sweet | 08 7323 7690 | 485 Main North Rd | Evanston | SA | 5116 | |
| TORRENS | Damian Leach | 08 7323 7691 | 33-37 Port Wakefield Rd | Gepps Cross | SA | 5094 | |
| UNLEY | Rachael Wepener | 08 7323 7692 | 15-31 Ayliffes Rd | St Marys | SA | 5042 | |
| WAITE | Colin Cameron | 08 7323 7693 | 15-31 Ayliffes Rd | St Marys | SA | 5042 | |
| WEST TORRENS | Kathryn Nagle | 08 7323 7694 | 300 Richmond Rd | Netley | SA | 5037 | |
| WRIGHT | Faye Gough | 08 7323 7695 | 33-37 Port Wakefield Rd | Gepps Cross | SA | 5094 |
An election was held to appoint three registered Architects to the Architectural Practice Board of South Australia, in accordance with the Architectural Practice (Election) Regulations 2025.
Count Summary
The scrutiny and count were conducted on Thursday 6 November 2025.
| Enrolled electors | 1,173 |
|---|---|
| Envelopes returned | 238 (20.29% return rate) |
| Envelopes accepted | 236 |
| Envelopes rejected | 2 |
| Voter participation* | 20.12% of the total enrolment |
| Formal votes | 236 |
| Informal votes | 0 |
| Quota | 60 |
* Participation is calculated as the number of formal and informal votes counted as a percentage of the number enrolled
Results
| Candidate | First preference votes | Percent | Votes at Exclusion / Election | Elected or Excluded |
| LE VAR, Brendan | 18 | 7.63% | 18 | Excluded |
| WARD, Stephen | 92 | 38.98% | Quota | ELECTED 1 |
| FROST, Simon | 57 | 24.15% | Quota | ELECTED 2 |
| COULTAS, Kirstie Lorraine | 41 | 17.37% | 65 | ELECTED 3 |
| MASULLO, Thomas | 28 | 11.86% | 40 | |
| Total | 236 |
Outcome of the election
As Stephen WARD obtained 92 first preference votes, they were provisionally declared elected over quota first on Thursday 6 November 2025.
After the distribution of preferences, Simon FROST was provisionally declared elected second on Thursday 6 November 2025.
After the distribution of preferences, Kirstie Lorraine COULTAS was provisionally declared elected third on Thursday 6 November 2025.
To view the distribution of votes refer to the scrutiny sheet.