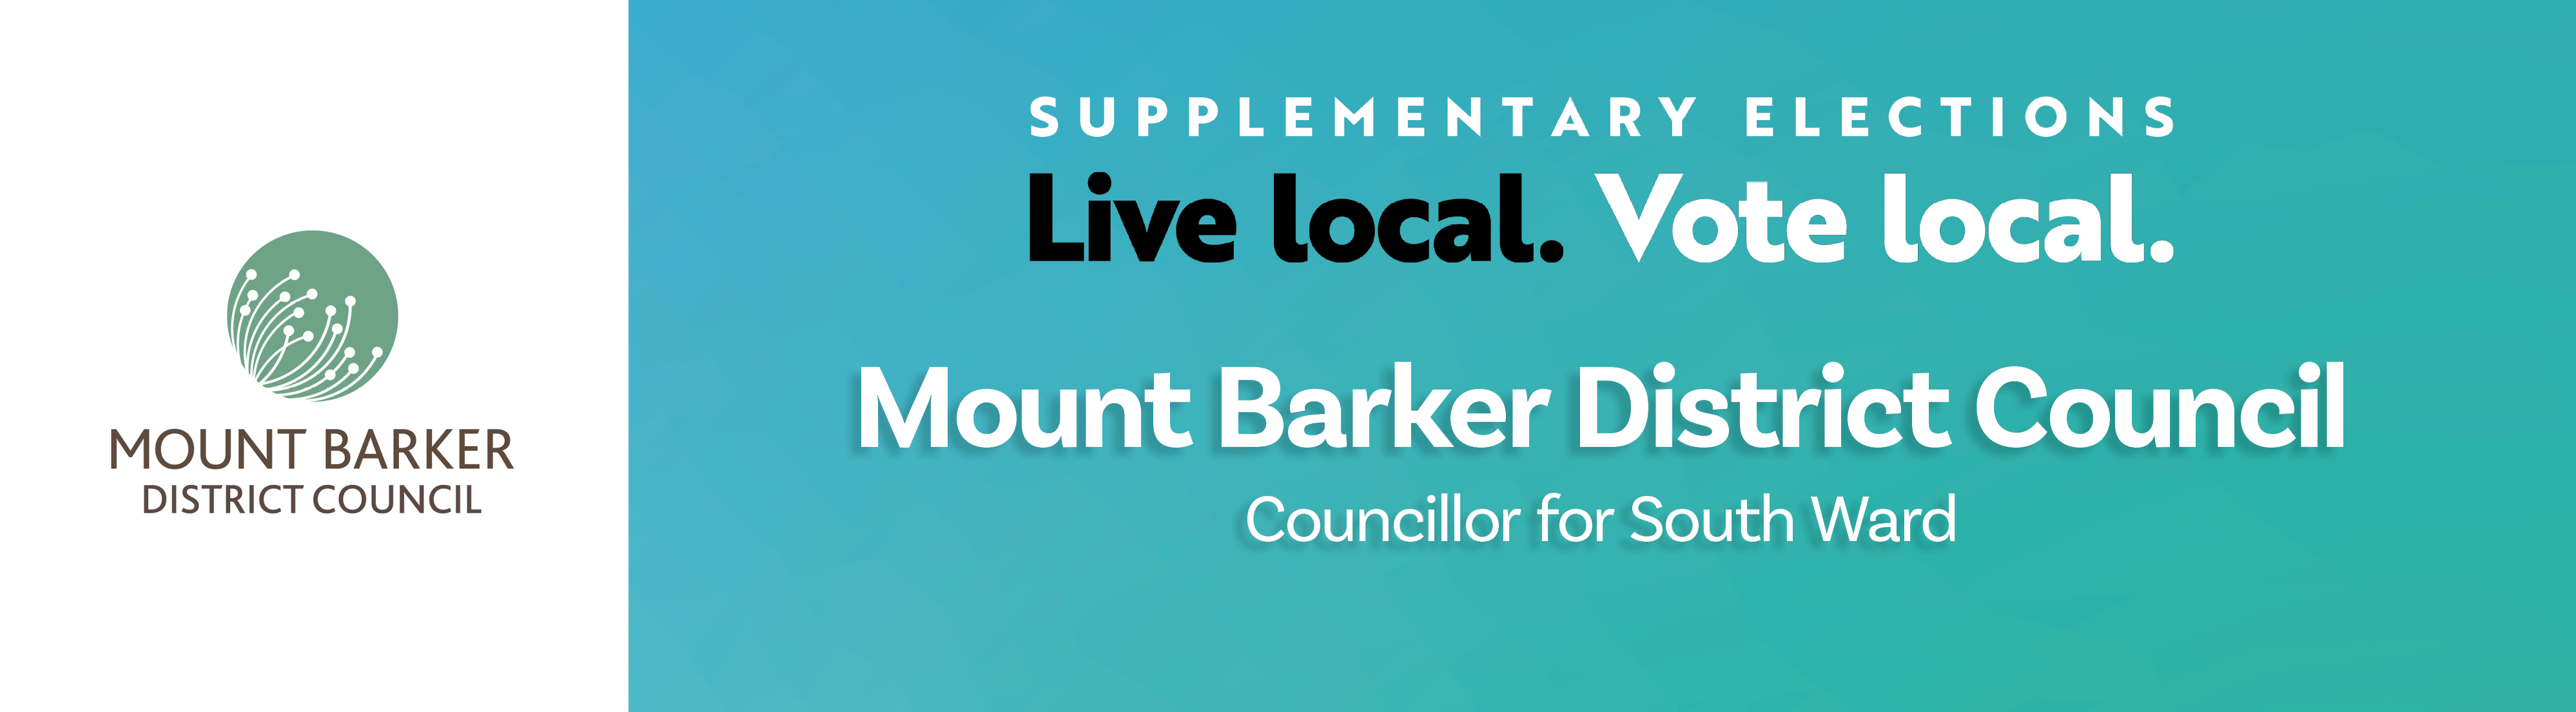
Elections
Counting the votes for council elections
The electoral system used in local government elections in South Australia is the proportional representation electoral system, or PR for short.
Counting the votes for the House of Assembly
To win a seat in the House of Assembly, a candidate must receive an absolute majority of the total formal votes cast in the electoral district they are contesting.
Counting the votes for the Legislative Council
In order to win a seat in the Legislative Council, a candidate is normally required to obtain a ‘quota’ of the formal votes. This quota - or minimum number of votes required to win a seat – ensures that winning candidates are elected with a near equal numbers of votes.
Where you can follow us
![]()
![]()
![]()
![]()
![]()
Count Summary
The scrutiny and count were conducted on Tuesday 23 September 2025.
| Enrolled electors | 8,946 |
|---|---|
| Envelopes returned | 2,174 (24.30% return rate) |
| Envelopes accepted | 2,148 |
| Envelopes rejected | 26 |
| Declaration envelopes excluded upon opening | 0 |
| Voter participation* | 24.01% of the total enrolment |
| Formal votes | 2,141 |
| Informal votes | 7 |
| Quota | 1,071 |
* Participation is calculated as the number of formal and informal votes counted as a percentage of the number of enrolled electors
Results
| Candidate | First preference votes | Percent | Votes at Exclusion / Election | Elected or Excluded |
| ATKINSON, Diane | 464 | 21.67% | 464 | Excluded |
| FORDHAM, Anne Elizabeth | 800 | 37.37% | 1,042 | ELECTED |
| KELLY, Darren | 877 | 40.96% | 948 | |
| Total | 2,141 |
Outcome of the election
After the distribution of preferences, Anne Elizabeth FORDHAM obtained 1,042 votes and was declared elected under quota at 03:04pm on Tuesday 23 September 2025.
To view the distribution of votes refer to the scrutiny sheet.
Daily Returns
| Event | Legislation* | Date |
|
Close of rolls |
s 6(7)(a), s 15(9)(b) |
5pm, Monday 30 June 2025 |
|
Nominations open |
s 19(4) |
Thursday 24 July 2025 |
|
Nominations close |
s 23(b) |
12 noon, Thursday 7 August 2025 |
|
Draw for positions on the ballot paper |
s 29(3)(b) |
as soon as practicable after 12 noon, Thursday 7 August 2025 Link to live draw https://www.youtube.com/live/5kCJcTQd2js |
|
First campaign donation return due |
s 80(3)(a)(ii) | Friday 15 August 2025 to Thursday 21 August 2025 |
|
Mailout of materials |
s 39(1) |
Tuesday 26 August 2025 to Monday 1 September 2025 |
|
Last day for re-issue of voting materials |
s 39(4), s 43(4) |
5pm, Monday 15 September 2025 |
|
Close of voting (polling day) |
s 6(6), s 6(7)(b) |
12 noon, Monday 22 September 2025 |
|
Scrutiny and count |
s 47(1)(a) |
Tuesday 23 September 2025 |
| Second campaign donation return due | s 80(3)(b) |
Within 30 days of the 'conclusion of the election' |
* Local Government (Elections) Act 1999
Enrolment
If you are correctly enrolled for state elections in South Australia, you are automatically included on the council voters roll and will receive ballot papers through the post.
If you need to check or update your enrolment for future elections, you can choose one of the following options:
- Check my enrolment
- Enrol online (first time voters or to get back on the roll)
- Update my details online (for updates to your address, name or other contact details)
Council supplementary roll
If you are not enrolled on the state electoral roll you may be eligible to register on the council supplementary roll if you are:
- a resident or a non-Australian citizen who has lived at your residential address for one month or more
- an owner of an organisation or business
- an owner of a holiday home
- a sole owner, or group of owners, of a rateable property
- a sole occupier, or group of occupiers, of a rateable property
- a landlord of rateable property.
In accordance with section 15(5a) of the Local Government (Elections) Act 1999, council must purge the council's supplementary roll on 1 January of every election year. Therefore, all landlords, organisations, business owners or occupiers, and resident non-Australian citizens, must re-enrol from January 1 of every election year to be eligible to vote, with the exception of the City of Adelaide.
If you are unsure whether you are enrolled on the council supplementary roll, contact your local council.
Candidate information and regulations
Visit our Candidate section for more information about;
- Acts and Regulations
- Candidate eligibility and ineligibility
- Candidate disclosure returns
- Candidate responsibilities
- Electoral advertising
- Forms and handbooks
- Responsibilities as a member of a council.
CANDIDATE PORTAL ACCESS (link to external website)
Due to the high volume of supplementary election events scheduled for September, our candidate portal is currently unable to accommodate individual Council names. As a result, we have opted to use the generic label "September 2025 Supplementary Elections" on the portal’s landing page. Candidates wishing to nominate will select this option, after which they can proceed to nominate within their respective election.
List of candidates
In accordance with the Local Government (Elections) Act 1999, the draw to determine the order of candidate names to appear on the ballot paper was held on Thursday 7 August 2025. The result of the draw are detailed below. Disclaimer; Candidate information is accurate as of the date of publication and will remain unchanged until archived.
ATKINSON, Diane
Having lived in Macclesfield for over 20 years, I am aware of some of the localised needs of the smaller towns, and will consult to further develop this awareness. Reflecting the needs of all members of our community will my central goal, if elected to council. Having raised two sons and then two nieces during their teen years, I will be a keen advocate for youth and family supports. Inclusiveness and community building are important aspects of this support that I would seek to promote. My other strong area of interest is in protecting our environment. Council manages water resources and waste, and has responsibility for community land, including important areas for native vegetation. I have a deep interest in all of these matters, and my work history includes 20 years working with soil water monitoring technology. More recently I worked in my family’s café business, so I also have experience of the challenges small businesses face, that would inform my input.
I live in South Ward
Contact Details: mblc @da-mail.aleeas.com
I am a member of Australian Greens SA

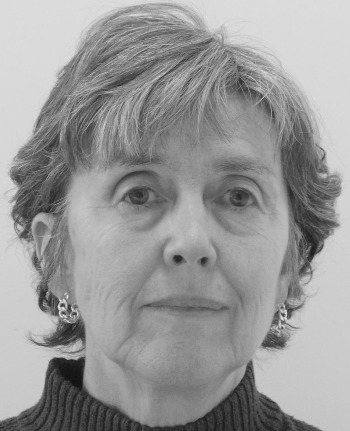
FORDHAM, Anne Elizabeth
I love the hills community and the lifestyle having lived here all my life. Let's create a sustainable future for the area and improve infrastructure, transport, housing, service delivery and the environment. I'm focused on community driven solutions and a stronger community voice, so I absolutely commit to listening and understanding your perspectives. There is a need to stand up for local issues and I have no political allegiances but want to work constructively. I work for federal government and have a Phd in social science- on corporate social responsibility. I own a hobby farm and have horses, alpacas and lots of wildlife. I'm connected to the community through membership of Hahndorf, Mylor and Mt Barker community groups, horses the env. and love campaigning on issues. We need more investment in the hills and to manage development. I also understand cost of living issues and will fight for more efficient delivery of services and cost cutting and be critical of business as usual.
I live in South Ward
Contact Details: annefordham9 @gmail.com
I am not a member of a Political Party

KELLY, Darren
I’m Darren Kelly, a Hahndorf local of 22 years who’s raised a family and runs a small business in the Adelaide Hills. I'm standing for election because I have the drive and conviction to represent the townships of South Ward especially Hahndorf, which faces unique challenges. I’ll bring common sense, accountability, and a back-to-basics approach to council, focused on core services like roads, rates, and rubbish. Many residents have told me they want less spent on discretionary programs and more attention on everyday essentials. If elected, I’ll work to limit rate increases by cutting waste, support practical traffic and parking solutions in Hahndorf, and apply sound thinking to local planning decisions. I’ll also fight to preserve the unique character of our towns by advocating for solutions on the issues threatening them. I bring a business background, an engineering mindset, and a strong commitment to transparency and real outcomes. Vote 1 Darren Kelly.
I live in South Ward
Contact Details: vote1darren @angard.au
I am a member of Pauline Hanson’s One Nation
Count Summary
The scrutiny and count were conducted on Tuesday 23 September 2025.
| Enrolled electors | 666 |
|---|---|
| Envelopes returned | 381 (57.21% return rate) |
| Envelopes accepted | 374 |
| Envelopes rejected | 7 |
| Declaration envelopes excluded upon opening | 0 |
| Voter participation* | 56.16% of the total enrolment |
| Formal votes | 371 |
| Informal votes | 3 |
| Quota | 124 |
* Participation is calculated as the number of formal and informal votes counted as a percentage of the number of enrolled electors
Results
| Candidate | First preference votes | Percent | Votes at Exclusion / Election | Elected or Excluded |
| JESSER, Roger Grant | 170 | 45.82% | 170 | ELECTED 1 |
| HOOPER, Shane | 50 | 13.48% | 50 | |
| CLARKE, Julia | 151 | 40.7% | 151 | ELECTED 2 |
| Total | 371 |
Outcome of the election
As Roger Grant JESSER obtained 170 first preference votes, they were declared elected over quota first at 10:45am on Tuesday 23 September 2025.
As Julia CLARKE obtained 151 first preference votes, they were declared elected over quota second at 10:45am on Tuesday 23 September 2025.
To view the distribution of votes refer to the scrutiny sheet.
Daily Returns
| Event | Legislation* | Date |
|
Close of rolls |
s 6(7)(a), s 15(9)(b) |
5pm, Monday 30 June 2025 |
|
Nominations open |
s 19(4) |
Thursday 24 July 2025 |
|
Nominations close |
s 23(b) |
12 noon, Thursday 7 August 2025 |
|
Draw for positions on the ballot paper |
s 29(3)(b) |
as soon as practicable after 12 noon, Thursday 7 August 2025 Link to live draw https://www.youtube.com/live/5kCJcTQd2js |
|
First campaign donation return due |
s 80(3)(a)(ii) | Friday 15 August 2025 to Thursday 21 August 2025 |
|
Mailout of materials |
s 39(1) |
Tuesday 26 August 2025 to Monday 1 September 2025 |
|
Last day for re-issue of voting materials |
s 39(4), s 43(4) |
5pm, Monday 15 September 2025 |
|
Close of voting (polling day) |
s 6(6), s 6(7)(b) |
12 noon, Monday 22 September 2025 |
|
Scrutiny and count |
s 47(1)(a) |
Tuesday 23 September 2025 |
| Second campaign donation return due | s 80(3)(b) |
Within 30 days of the 'conclusion of the election' |
* Local Government (Elections) Act 1999
Enrolment
If you are correctly enrolled for state elections in South Australia, you are automatically included on the council voters roll and will receive ballot papers through the post.
If you need to check or update your enrolment for future elections, you can choose one of the following options:
- Check my enrolment
- Enrol online (first time voters or to get back on the roll)
- Update my details online (for updates to your address, name or other contact details)
Council supplementary roll
If you are not enrolled on the state electoral roll you may be eligible to register on the council supplementary roll if you are:
- a resident or a non-Australian citizen who has lived at your residential address for one month or more
- an owner of an organisation or business
- an owner of a holiday home
- a sole owner, or group of owners, of a rateable property
- a sole occupier, or group of occupiers, of a rateable property
- a landlord of rateable property.
In accordance with section 15(5a) of the Local Government (Elections) Act 1999, council must purge the council's supplementary roll on 1 January of every election year. Therefore, all landlords, organisations, business owners or occupiers, and resident non-Australian citizens, must re-enrol from January 1 of every election year to be eligible to vote, with the exception of the City of Adelaide.
If you are unsure whether you are enrolled on the council supplementary roll, contact your local council.
Candidate information and regulations
Visit our Candidate section for more information about;
- Acts and Regulations
- Candidate eligibility and ineligibility
- Candidate disclosure returns
- Candidate responsibilities
- Electoral advertising
- Forms and handbooks
- Responsibilities as a member of a council.
CANDIDATE PORTAL ACCESS (link to external website)
Due to the high volume of supplementary election events scheduled for September, our candidate portal is currently unable to accommodate individual Council names. As a result, we have opted to use the generic label "September 2025 Supplementary Elections" on the portal’s landing page. Candidates wishing to nominate will select this option, after which they can proceed to nominate within their respective election.
List of candidates
In accordance with the Local Government (Elections) Act 1999, the draw to determine the order of candidate names to appear on the ballot paper was held on Thursday 7 August 2025. The result of the draw are detailed below. Disclaimer; Candidate information is accurate as of the date of publication and will remain unchanged until archived.
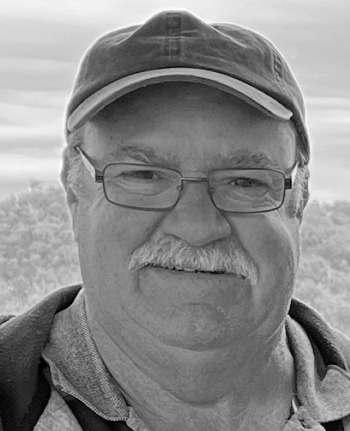
JESSER, Roger Grant
I have lived in Orroroo since 1972. I completed my schooling here. I completed a mechanical trade here in a local service station, worked as a parts interpreter at another local garage, managed the Orroroo hotel at one stage and participated in many sporting clubs, holding several positions in all clubs from bar manager to president. This demonstrates my interest and commitment I have for the town and the people in it. As I am now retired, I now have more time to contribute to the town by participating in council decisions and activities. I have always successfully worked in team environments as I believe they produce the best outcomes. I feel that I would be a worthy member of council because of my commitment to the local area.
I live in the area
Contact Details: rogerjesser65 @gmail.com
I am not a member of a Political Party

HOOPER, Shane
As a proud local and dad of two young girls, I’m passionate about making sure Orroroo stays a positive and welcoming place for families to live, work and grow. I’m actively involved in our community through local swimming, tennis, netball and even dabble at bowls! I also serve as Vice Chair of the Orroroo Area School Governing Council and on the Christmas pageant committee. I care deeply about our town’s future and want to represent the everyday people who call it home. I’ll listen, ask questions, and work hard to keep Orroroo moving forward.
I live in the area
Contact Details: 0428 378 862
I am not a member of a Political Party
Campaign Donation Return #1
Campaign Donation Return #2
CLARKE, Julia
I have lived in the Orroroo/Carrieton District Council for a total of 15 years. Residing about 25 kilometres north of Carrieton I assist in the running of our grazing property. After initially living in the council area for 12 years we moved to the Burra area with our children for about 13 years and have relished living back in this area for the last three years. I am passionate about agriculture and supporting those living in regional areas. I have committed myself to voluntary roles in both the council areas I have resided in.
I live in the area
Contact Details: julia @pamatta.com.au
I am not a member of a Political Party
Count Summary
The scrutiny and count were conducted on Tuesday 28 October 2025.
| Enrolled electors | 752 |
|---|---|
| Envelopes returned | 492 (65.43% return rate) |
| Envelopes accepted | 489 |
| Envelopes rejected | 3 |
| Declaration envelopes excluded upon opening | 0 |
| Voter participation* | 65.03% of the total enrolment |
| Formal votes | 484 |
| Informal votes | 5 |
| Quota | 162 |
* Participation is calculated as the number of formal and informal votes counted as a percentage of the number of enrolled electors
Results
| Candidate | First preference votes | Percent | Votes at Exclusion / Election | Elected or Excluded |
| HARRIS, Robyn | 167 | 34.5% | 167 | ELECTED 1 |
| SCOTT, Toni Ann | 117 | 24.17% | 216 | ELECTED 2 |
| BALDOCK, Jeff | 112 | 23.14% | 143 | Excluded |
| SOLLY, Joshua | 57 | 11.78% | 69 | Excluded |
| RAYNER, Carmen | 31 | 6.4% | 31 | Excluded |
| Total | 484 |
Outcome of the election
As Robyn HARRIS obtained 167 first preference votes, they were provisionally declared elected over quota first at 11:19am on Tuesday 28 October 2025.
After the distribution of preferences, Toni Ann SCOTT obtained 216 votes and was provisionally declared elected over quota second at 11:19am on Tuesday 28 October 2025.
To view the distribution of votes refer to scrutiny sheet.
Daily Returns
| Event | Legislation* | Date |
|
Close of rolls |
s 6(7)(a), s 15(9)(b) |
5pm, Thursday 31 July 2025 |
|
Nominations open |
s 19(4) |
Thursday 28 August 2025 |
|
Nominations close |
s 23(b) |
12 noon, Thursday 11 September 2025 |
|
Draw for positions on the ballot paper |
s 29(3)(b) |
as soon as practicable after 12 noon, Thursday 11 September 2025 |
|
First campaign donation return due |
s 80(3)(a)(ii) | Friday 19 September 2025 to Thursday 25 September 2025 |
|
Mailout of materials |
s 39(1) |
Tuesday 30 September 2025 to Monday 6 October 2025 |
|
Last day for re-issue of voting materials |
s 39(4), s 43(4) |
5pm, Monday 20 October 2025 |
|
Close of voting (polling day) |
s 6(6), s 6(7)(b) |
12 noon, Monday 27 October 2025 |
|
Scrutiny and count |
s 47(1)(a) |
Tuesday 28 October 2025 |
| Second campaign donation return due | s 80(3)(b) |
Within 30 days of the 'conclusion of the election' |
* Local Government (Elections) Act 1999
Enrolment
If you are correctly enrolled for state elections in South Australia, you are automatically included on the council voters roll and will receive ballot papers through the post.
If you need to check or update your enrolment for future elections, you can choose one of the following options:
- Check my enrolment
- Enrol online (first time voters or to get back on the roll)
- Update my details online (for updates to your address, name or other contact details)
Council supplementary roll
If you are not enrolled on the state electoral roll you may be eligible to register on the council supplementary roll if you are:
- a resident or a non-Australian citizen who has lived at your residential address for one month or more
- an owner of an organisation or business
- an owner of a holiday home
- a sole owner, or group of owners, of a rateable property
- a sole occupier, or group of occupiers, of a rateable property
- a landlord of rateable property.
In accordance with section 15(5a) of the Local Government (Elections) Act 1999, council must purge the council's supplementary roll on 1 January of every election year. Therefore, all landlords, organisations, business owners or occupiers, and resident non-Australian citizens, must re-enrol from January 1 of every election year to be eligible to vote, with the exception of the City of Adelaide.
If you are unsure whether you are enrolled on the council supplementary roll, contact your local council.
Candidate information and regulations
Visit our Candidate section for more information about;
- Acts and Regulations
- Candidate eligibility and ineligibility
- Candidate disclosure returns
- Candidate responsibilities
- Electoral advertising
- Forms and handbooks
- Responsibilities as a member of a council.
CANDIDATE PORTAL ACCESS (linked website)
List of candidates
In accordance with the Local Government (Elections) Act 1999, the draw to determine the order of candidate names to appear on the ballot paper was held on Thursday 11 September 2025. The result of the draw are detailed below.
HARRIS, Robyn
I am passionate about ensuring we continue to have a vibrant, progressive and well serviced local community into the future. With a background in nursing, small business and community services, I bring practical knowledge, financial management skills, new ideas and enthusiasm to the table. I am currently involved locally as a SA Ambulance Service volunteer and Eyre Hub board member. For our community to thrive, we need access to childcare to give individuals an opportunity to return to their chosen profession, which, in turn, unlocks skill shortages. We need access to housing to enable business to employ staff, which helps grow our population. I recognise we face the ongoing challenge of securing a doctor and acknowledge just how important continuity of health care is. Together, we can shape the future of the community. I invite you to share your ideas, raise your concerns and join me in progressing the great work that has been done by people before me.
I live in the area
Contact Details: 0428 272 123
I am not a member of a Political Party
SCOTT, Toni Ann
25 years ago I moved to Kimba a young girl starting work life with my first of many local employers. I married a local farmer and have proudly called Kimba my home ever since. I immediately started my volunteering journey with the Youth Advisory Committee, an initiative of Local Council. I became an active member of the Netball and Basketball Clubs and have volunteered in coaching and committee roles the entire time I have lived here. Over the past 15 years I have dedicated my time to raising our 3 children, helping manage the family farm whilst always remaining employed part time with local business'. I have continued to serve as a volunteer with interest in a diverse range of local groups including the Kimba Christmas Tree Committee and the Kimba Hospital Auxiliary. As a mum of teenage kids I believe I could fill a role on council that isn't currently represented. I have always said Kimba is the best place in the world to raise a family and I'm passionate about keeping it that way.
I live in the area
Contact Details: camandtoniscott @gmail.com
I am not a member of a Political Party

BALDOCK, Jeff
I am a 68 year old, semi-retired farmer. Having lived in the Kimba District all my life I am passionate about making sure Kimba not only survives by thrives into the future. Our family have been proud members of this community for generations and now with our 2 sons and daughter and their families all living here I am very focused on making Kimba the best place it can be. I have enjoyed all of the advantages of being a member of this community, playing, coaching, umpiring in sporting clubs as well as being on various committees and volunteering in various groups. Kimba is a great place to live, but I believer we need to find a way to attract new industries to strengthen our community. After being involved in farming all my life my wife and I have handed over the running of the family farm to the next generations meaning I will have more time to give back to the community so I am asking you to consider me as a candidate for the upcoming supplementary Council election.
I live in the area
Contact Details: jfbaldock @bigpond.com
I am a member of the Liberal Party of Australia (SA Division)

SOLLY, Joshua
After relocating from Adelaide, I’ve been proud to call Kimba home for just shy of eight years now. In that time, I’ve built strong connections through my involvement on a number of local committees, sporting clubs, and community initiatives. You might have seen me on the football oval or the cricket pitch, but I’ve been just as active behind the scenes - contributing ideas, energy, and time. As a Store Manager and Stock Agent in my professional life, I bring leadership, problem-solving, and a strong ability to listen, collaborate and plan. At home, I’m a husband to Esther, our local Kindy Director, and a soon-to-be father, which supports my interest in wanting to help shape our community for the benefit of future generations. I am standing for election because I believe our district can continue to grow and thrive - where local voices are valued and services are strengthened. I will bring energy, experience, and a fresh perspective to the role.
I live in the area
Contact Details: joshua.solly @live.com.au
I am not a member of a Political Party
RAYNER, Carmen
Kimba always has and will forever lie at the heart of my sense of home and community. I am fully supportive of the continuing development of the fantastic community we currently enjoy. Previously I have served on the Tourism Advisory Committee, Development Group, KAS and Kindy Governing Councils and Kimba Show committee. I am a founding member of Workshop26 Inc. and currently an active member of the KDFNC and serve on the Netball Committee. Owner of The Small Town Soap Co, manufacturing and distributing handmade products Australia wide. I am also a farmer, wife of Clint and mother to Edie, Connie, and Reg. I care deeply about our local health services and am passionate about the growth and sustainability of our community, and the development of our tourism industry. Supporting all demographics within our community is important to me. If elected, I will strive to ensure Council makes sound decisions that benefit our community and make Kimba an even better place to call home.
I live in the area
Contact Details: carmen @smalltownsoap.com.au
I am not a member of a Political Party
Campaign Donation Return 2