Elections
Count Summary
The scrutiny and count were conducted on Tuesday 28 October 2025.
| Enrolled electors | 4,288 |
|---|---|
| Envelopes returned | 1,071 (24.98% return rate) |
| Envelopes accepted | 1,059 |
| Envelopes rejected | 12 |
| Declaration envelopes excluded upon opening | 1 |
| Voter participation* | 24.67% of the total enrolment |
| Formal votes | 1,056 |
| Informal votes | 2 |
| Quota | 529 |
* Participation is calculated as the number of formal and informal votes counted as a percentage of the number of enrolled electors
Results
| Candidate | First preference votes | Percent | Votes at Exclusion / Election | Elected or Excluded |
| SHEPHERDSON, Kevin | 79 | 7.48% | 90 | Excluded |
| GALLASCH, Paul | 111 | 10.51% | 197 | Excluded |
| CICCARELLO, Vini | 107 | 10.13% | 149 | Excluded |
| MARSH, Tracy | 64 | 6.06% | 68 | Excluded |
| WILKINSON, Sandy | 240 | 22.73% | 424 | ELECTED |
| HAYES, Paul | 164 | 15.53% | 315 | |
| HOLMES, Mike | 53 | 5.02% | 53 | Excluded |
| MORGAN, Anna | 36 | 3.41% | 41 | Excluded |
| HEAD, James | 81 | 7.67% | 114 | Excluded |
| BAKER, David | 92 | 8.71% | 98 | Excluded |
| ERICHSDOTTER, Barbara | 29 | 2.75% | 29 | Excluded |
| Total | 1,056 |
Outcome of the election
After the distribution of preferences, Sandy WILKINSON obtained 424 votes and was provisionally declared elected under quota at 02:25pm on Tuesday 28 October 2025.
To view the distribution of votes refer to scrutiny sheet.
Daily Returns
| Event | Legislation* | Date |
|
Close of rolls |
s 6(7)(a), s 15(9)(b) |
5pm, Thursday 31 July 2025 |
|
Nominations open |
s 19(4) |
Thursday 28 August 2025 |
|
Nominations close |
s 23(b) |
12 noon, Thursday 11 September 2025 |
|
Draw for positions on the ballot paper |
s 29(3)(b) |
as soon as practicable after 12 noon, Thursday 11 September 2025 |
|
First campaign donation return due |
s 80(3)(a)(ii) | Friday 19 September 2025 to Thursday 25 September 2025 |
|
Mailout of materials |
s 39(1) |
Tuesday 30 September 2025 to Monday 6 October 2025 |
|
Last day for re-issue of voting materials |
s 39(4), s 43(4) |
5pm, Monday 20 October 2025 |
|
Close of voting (polling day) |
s 6(6), s 6(7)(b) |
12 noon, Monday 27 October 2025 |
|
Scrutiny and count |
s 47(1)(a) |
Tuesday 28 October 2025 |
| Second campaign donation return due | s 80(3)(b) |
Within 30 days of the 'conclusion of the election' |
* Local Government (Elections) Act 1999
Enrolment
If you are correctly enrolled for state elections in South Australia, you are automatically included on the council voters roll and will receive ballot papers through the post.
If you need to check or update your enrolment for future elections, you can choose one of the following options:
- Check my enrolment
- Enrol online (first time voters or to get back on the roll)
- Update my details online (for updates to your address, name or other contact details)
Council supplementary roll
If you are not enrolled on the state electoral roll you may be eligible to register on the council supplementary roll if you are:
- a resident or a non-Australian citizen who has lived at your residential address for one month or more
- an owner of an organisation or business
- an owner of a holiday home
- a sole owner, or group of owners, of a rateable property
- a sole occupier, or group of occupiers, of a rateable property
- a landlord of rateable property.
In accordance with section 15(5a) of the Local Government (Elections) Act 1999, council must purge the council's supplementary roll on 1 January of every election year. Therefore, all landlords, organisations, business owners or occupiers, and resident non-Australian citizens, must re-enrol from January 1 of every election year to be eligible to vote, with the exception of the City of Adelaide.
If you are unsure whether you are enrolled on the council supplementary roll, contact your local council.
Candidate information and regulations
Visit our Candidate section for more information about;
- Acts and Regulations
- Candidate eligibility and ineligibility
- Candidate disclosure returns
- Candidate responsibilities
- Electoral advertising
- Forms and handbooks
- Responsibilities as a member of a council.
CANDIDATE PORTAL ACCESS (linked website)
List of candidates
In accordance with the Local Government (Elections) Act 1999, the draw to determine the order of candidate names to appear on the ballot paper was held on Thursday 11 September 2025. The result of the draw are detailed below. Disclaimer; Candidate information is accurate as of the date of publication and will remain unchanged until archived.
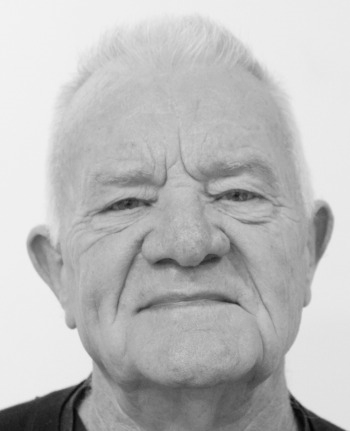
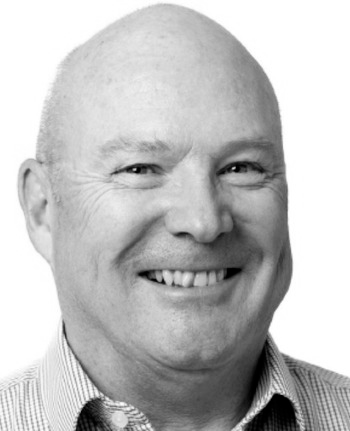
SHEPHERDSON, Kevin
Kevin is a dedicated community member with a strong history of local service and leadership. As a former councilor, he brings valuable experience with a deep understanding of the needs of local residents. A proud family man, his commitment to community is reflected in his many volunteer roles. Kevin serves as a Justice of the Peace, supports men's wellbeing through his involvement in the local Men's Shed, and assists residents as a community bus driver. Kevin is passionate about making our neighborhood safer and more livable. One key priority as a candidate for the West Norwood/Kent Town ward is addressing the growing issue of available on-street parking. Kevin aims to work collaboratively with residents and stakeholders to find practical, fair solutions that ease congestion and improve access for all. With a strong track record of service and a genuine desire to make a difference, Kevin is ready to listen, act and deliver for his community once again and seeks your support.
I live in West Norwood/Kent Town Ward
Contact Details: kevin_469 @outlook.com
I am not a member of a Political Party

GALLASCH, Paul
I am a filmmaker and small business owner in Stepney, where I live with my wife and four children, and from where I frequently visit (mostly on foot or bicycle) Kent Town & West Norwood. I own and operate the literary bar Ern Malley est. 1943, which is dedicated to supporting the local arts and fostering community. I also recently organized Unbreaking Adelaide, an annual symposium on heritage architecture and urban planning. I’ve lived in some of the world’s most exciting and romantic cities, including New Orleans, New York, Venice, Berlin, and Mumbai and I’m passionate about helping our town become an even more festive, connected and romantic place to live, while protecting the peaceful and wholesome lifestyle we all cherish here. I believe that we must be prepared to think creatively and act courageously in order to protect and encourage a strong sense of community in our neighborhoods - a vital part of any good and hope-filled life.
I do not live in West Norwood/Kent Town Ward
Contact Details: paul @ernmalley.com.au
I am not a member of a Political Party

CICCARELLO, Vini
I have lived and worked in our Norwood community since childhood. Its cosmopolitan character has shaped who I am. My local knowledge and experiences mean that I know how councils and governments work and given me the ability to get things done. I commit to getting the best possible allocation of resources for your rates. I am passionate about the Parade, the heart and soul of our community, and want to ensure its revitalisation respects its history and protects what locals love about it. I am keen to see the development of the Norwood library as an important education resource and community hub, sustainable urban development designed to meet changing needs, respecting the heritage character of the area with innovative designs. I support the development of open space, our parks, street trees, sporting facilities and traffic management to provide safer roads and improved parking plus initiatives to assist small business. Most of all I want to give residents and businesses a strong voice.
I do not live in West Norwood/Kent Town Ward
Contact Details: viniciccarello @gmail.com
I am a member of the Australian Labor Party (South Australian Branch)
MARSH, Tracy
For nearly 25 years, I have called West Norwood/Kent Town home living, working, and running businesses right here in our community. I know our challenges and priorities because I’ve lived them. As a local employer, long-time business owner in publishing and hospitality, and a mum who raised my daughter here, I bring proven experience, financial knowledge, and a genuine commitment to making our neighbourhood thrive. On council, I’ll fight for projects that deliver real results for the people who live and work in our local area, with fresh ideas, energy, and accountability. I want to ensure we have a council that listens, respects, and delivers for our community. Together, we can shape a stronger future for Norwood, Payneham & St Peters. tracy @tracymarsh.com
I live in West Norwood/Kent Town Ward
Contact Details: tracy @tracymarsh.com
I am a member of the Liberal Party of Australia (SA Division)
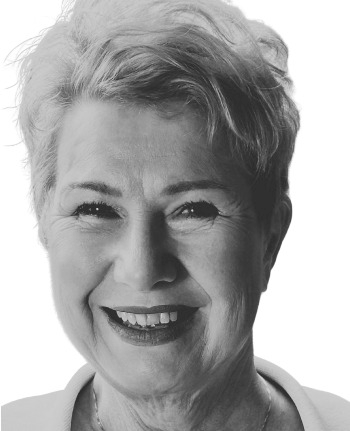
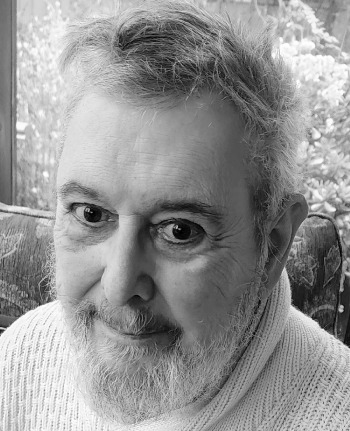
WILKINSON, Sandy
Former Adelaide City Councillor (2007-2018), Sandy Wilkinson is known for his passion about Council issues, development and Heritage in particular. Sandy has always pushed for a better standard of development and urban design and acted to save our presently unprotected historic character buildings of which Norwood has much. Sandy is President of Community Alliance SA, has degrees in both Planning and Architecture, with Honours in Conservation with a small design practice in Norwood specialising in heritage, and residential design, providing an informed perspective on development. Practicing what he preaches, Sandy lives in a Local Heritage house in Osmond Terrace with his wife and two children which they bought from someone intent on demolishing, and instead developed three townhouses behind the historic house, which he has restored. Sandy believes we should capitalise on our historic assets, for the benefit of his children and all who call Norwood home.
www.sandywilkinson.com.au
I live in West Norwood/Kent Town Ward
Contact Details: 0407 493 192
I am not a member of a Political Party

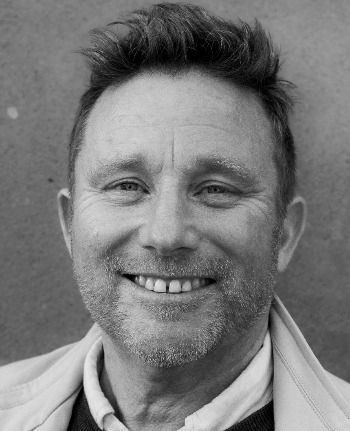
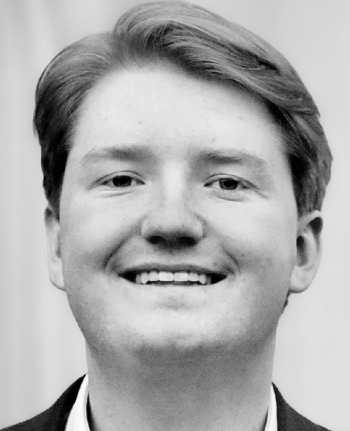
HAYES, Paul
I am a recently-retired lawyer. I worked in both the governmental and not-for-profit sectors for many years. My partner, Jonathan and I moved to Norwood in 2017. We love the community, its vibrancy and lifestyle. In an increasingly complex and frenetic world, I am a calm, competent person. I have the skills and experience to effectively represent the residents of West Norwood/Kent Town. If elected, I will work to ensure council decisions are transparent, ratepayers’ money is well spent and projects are delivered on time and on budget. In the face of moves to increase urban density with multi-storied apartments, it is vital our Council strikes the right balance between thoughtful development and the preservation of the character and amenities of our much-loved neighbourhood. If elected, I will advocate for improved traffic management along Magill Road and for ongoing investment in the Council’s green and tree-lined spaces, including Richards Park, Osmond Terrace, and Hutchinson Park.
I live in West Norwood/Kent Town Ward
Contact Details: pmhayes2025 @gmail.com
I am not a member of a Political Party
HOLMES, Mike
Having lived in the West Norwood & Kent Town Ward for nearly 30 years at 6 addresses across a mixture of building types (detached single story dwelling, semi-detached, high rise), I understand from a variety of perspectives what it is like to live here. I love the area and the advantages of being close to the city, the hustle and bustle of The Parade, the elegance of the heritage buildings and the beauty of our parks. I also understand the modern-day issues created by parking, noise and traffic. Things I cannot promise to solve, but I will promise to listen to. Having also served (and continue to serve) as a Community Title Presiding Officer on two occasions, my approachable style has enabled me to help communities move through some challenging times. Serving the Ward, I aim to always listen, learn, plan, act & feedback. Thank you for your support.
I live in West Norwood/Kent Town Ward
Contact Details: mgholmes66 @outlook.com
I am not a member of a Political Party
MORGAN, Anna
I'm nominating to represent Norwood West / Kent Town ward with a strong focus on building community. I grew up in the ward, attended Norwood Primary, and have deep roots here with most of my family still in the area. I support the creation of stronger local arts programs through community groups, workshops, and gallery space to help strengthen connections especially as social isolation grows. I will advocate for better services for the elderly, support volunteer programs and local resident associations. I’ll champion local voices in council and work to ensure the community is heard in decision-making. I’m committed to preserving green spaces while balancing safety through responsible tree management, and will address local issues such as traffic and parking where possible. I believe in thoughtful progress that respects and protects our area's unique heritage. Let’s build a connected, safe, and forward-thinking community together.
I do not live in West Norwood/Kent Town Ward
Contact Details: annamorgan @gmail.com
I am not a member of a Political Party

HEAD, James
I am running for Council in the West Norwood & Kent Town ward of which I am a ratepayer and resident with my wife and young daughter. I am an experienced Project Manager working for a locally based international engineering firm, with experience in industry and government (including in policy). I can utilise my extensive stakeholder management and project control skills to ensure all resident concerns are raised and that the best value for money for ratepayers and residents on council projects and initiatives is delivered. Areas of concern which have been highlighted to me include the following: Parking & Congestion Issues, Increase in Rates, Heritage Preservation, Sensitive Urban Development and Preserving Green Canopy & Public Parks. We live in one of the most vibrant areas of Adelaide and I want to fight for your voice to be heard and leave a positive impact on the future generations of Norwood & Kent Town residents. Please contact on: James4Norwood @outlook.com
I live in West Norwood/Kent Town Ward
Contact Details: James4Norwood @outlook.com
I am a member of the Liberal Party of Australia (SA Division)
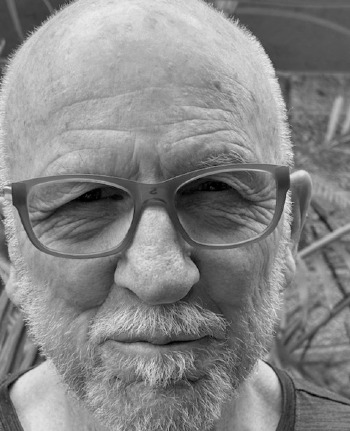
BAKER, David
I am a Kent Town resident of 27 years, and an active community advocate. I bring professional experience in government, tertiary education, heritage, community engagement and resource management. I believe in action, not just words and led initiatives for establishing resident organisations; liaison with older residents; achieving and celebrating heritage protection especially Dr Kent’s Paddock; advocate for traffic management, safer intersections and improved footpaths; tree planting e.g. along Rundle Street to create greener, healthier streets for residents and businesses. The West Norwood/Kent Town Ward has significant heritage, art, culture and business activity, but has often been overlooked. I will ensure Council recognises our unique needs, invests in sustainable growth, and strengthens safety and amenity for all. My commitment is to evidence-based, cost effective decision-making, transparent representation and collaboration with residents and businesses. Call on 0418 891 807
I live in West Norwood/Kent Town Ward
Contact Details: 0418 891 807
I am a member of Australian Greens SA
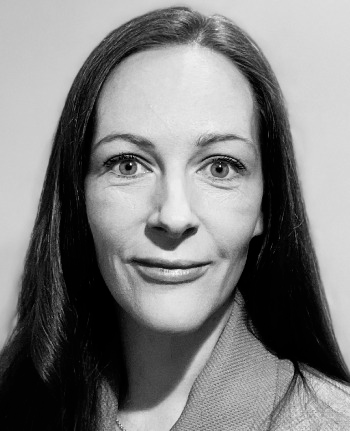
ERICHSDOTTER, Barbara
I am a semi-retired public health and health industry consultant and have previously been a Councillor for the City of Norwood, Payneham & St Peters. I sat on a number of sub-committees, served as the inaugural chair of the Adelaide Fashion Festival, and represented the Council on a number of external committees. Currently I volunteer in the aged care and public health sectors. I am passionate about our city's natural and built environments, all of which contribute to residents' well-being. I am a strong advocate for healthy living and aging well and believe Councils can play an important role in community well-being. I wish to serve the community again, and to be a strong advocate for residents, ensuring fair and equitable access to all facilities and services. I will always listen to your concerns and will ensure your voice is heard. Should you have any questions please feel free to contact me either by email, below, or by phone on 0419 348 222.
I do not live in West Norwood/Kent Town Ward
Contact Details: bbaustralia @hotmail.com
I am not a member of a Political Party
Count Summary
The scrutiny and count were conducted on Tuesday 23 September 2025.
| Enrolled electors | 18,861 |
|---|---|
| Envelopes returned | 4,169 (22.10% return rate) |
| Envelopes accepted | 4,097 |
| Envelopes rejected | 72 |
| Declaration envelopes excluded upon opening | 0 |
| Voter participation* | 21.72% of the total enrolment |
| Formal votes | 4,080 |
| Informal votes | 17 |
| Quota | 2,041 |
* Participation is calculated as the number of formal and informal votes counted as a percentage of the number of enrolled electors
Results
| Candidate | First preference votes | Percent | Votes at Exclusion / Election | Elected or Excluded |
| WOOLCOCK, Lisa Clare | 987 | 24.19% | 1,846 | ELECTED |
| McDONNELL, Georgia | 790 | 19.36% | 1,160 | Excluded |
| TRANTER, Jenn | 422 | 10.34% | 451 | Excluded |
| CUTHBERTSON, Mark | 1,082 | 26.52% | 1,482 | |
| SADLER, James Grant | 431 | 10.56% | 497 | Excluded |
| De'ATH, James | 368 | 9.02% | 368 | Excluded |
| Total | 4,080 |
Outcome of the election
After the distribution of preferences, Lisa Clare WOOLCOCK obtained 1,846 votes and was declared elected under quota at 05:06pm on Tuesday 23 September 2025.
To view the distribution of votes refer to the scrutiny sheet.
Daily Returns
| Event | Legislation* | Date |
|
Close of rolls |
s 6(7)(a), s 15(9)(b) |
5pm, Monday 30 June 2025 |
|
Nominations open |
s 19(4) |
Thursday 24 July 2025 The Adelaide Hills Council will be holding an in-person candidate briefing session for Ranges Ward from 6pm to 8pm on Wednesday 23 July 2025 at Stirling Chamber, 63 Mount Barker Road, Stirling. |
|
Nominations close |
s 23(b) |
12 noon, Thursday 7 August 2025 |
|
Draw for positions on the ballot paper |
s 29(3)(b) |
as soon as practicable after 12 noon, Thursday 7 August 2025 Link to live draw https://www.youtube.com/live/5kCJcTQd2js |
|
First campaign donation return due |
s 80(3)(a)(ii) | Friday 15 August 2025 to Thursday 21 August 2025 |
|
Mailout of materials |
s 39(1) |
Tuesday 26 August 2025 to Monday 1 September 2025 |
|
Last day for re-issue of voting materials |
s 39(4), s 43(4) |
5pm, Monday 15 September 2025 |
|
Close of voting (polling day) |
s 6(6), s 6(7)(b) |
12 noon, Monday 22 September 2025 |
|
Scrutiny and count |
s 47(1)(a) |
Tuesday 23 September 2025 |
| Second campaign donation return due | s 80(3)(b) |
Within 30 days of the 'conclusion of the election' |
* Local Government (Elections) Act 1999
Enrolment
If you are correctly enrolled for state elections in South Australia, you are automatically included on the council voters roll and will receive ballot papers through the post.
If you need to check or update your enrolment for future elections, you can choose one of the following options:
- Check my enrolment
- Enrol online (first time voters or to get back on the roll)
- Update my details online (for updates to your address, name or other contact details)
Council supplementary roll
If you are not enrolled on the state electoral roll you may be eligible to register on the council supplementary roll if you are:
- a resident or a non-Australian citizen who has lived at your residential address for one month or more
- an owner of an organisation or business
- an owner of a holiday home
- a sole owner, or group of owners, of a rateable property
- a sole occupier, or group of occupiers, of a rateable property
- a landlord of rateable property.
In accordance with section 15(5a) of the Local Government (Elections) Act 1999, council must purge the council's supplementary roll on 1 January of every election year. Therefore, all landlords, organisations, business owners or occupiers, and resident non-Australian citizens, must re-enrol from January 1 of every election year to be eligible to vote, with the exception of the City of Adelaide.
If you are unsure whether you are enrolled on the council supplementary roll, contact your local council.
Candidate information and regulations
Visit our Candidate section for more information about;
- Acts and Regulations
- Candidate eligibility and ineligibility
- Candidate disclosure returns
- Candidate responsibilities
- Electoral advertising
- Forms and handbooks
- Responsibilities as a member of a council.
CANDIDATE PORTAL ACCESS (link to external website)
Due to the high volume of supplementary election events scheduled for September, our candidate portal is currently unable to accommodate individual Council names. As a result, we have opted to use the generic label "September 2025 Supplementary Elections" on the portal’s landing page. Candidates wishing to nominate will select this option, after which they can proceed to nominate within their respective election.
List of candidates
In accordance with the Local Government (Elections) Act 1999, the draw to determine the order of candidate names to appear on the ballot paper was held on Thursday 7 August 2025. The result of the draw are detailed below.
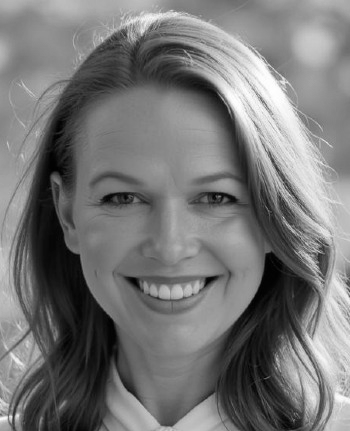
WOOLCOCK, Lisa Clare
I am a Stirling local and single mum to a 9 year old son, with over two decades of experience in people-centric industries including hospitality, tourism, business development and stakeholder engagement. My perspective is shaped by life across other countries and cultures, and grounded in the lived experience of parenting a child with additional needs. I bring empathy, resilience and a collaborative mindset, along with a deep appreciation for inclusion and real world connection in a time of growing social disconnection. Council plays a vital role in bringing people together. I’m committed to respectful, transparent and community first decision making. Priorities include safe, reliable service delivery, sustainable development, support for local business, youth engagement, vibrant community spaces and responsible fiscal management. Adelaide Hills deserves future focused leadership that listens, learns and works together to deliver outcomes that help communities thrive.
I live in Ranges Ward
Contact Details: 0431 575 482
I am a member of the Australian Labor Party (South Australian Branch)

McDONNELL, Georgia
I have lived in Upper Sturt for 24 years and can't imagine living anywhere but the Adelaide Hills. Like many in our region, I am a small business owner and volunteer. I think that many of the day-to-day problems we face can only be solved by listening to one another, learning different points of view, and working together to find solutions. It’s thanks to nearly 20 years of connection with the Upper Sturt Soldiers Memorial Hall, and many other groups I have volunteered with, that I’ve been able to learn this. I am trained in community engagement and want to use these skills to benefit ratepayers and residents. I would like to see rates go into services like road repair, weed control, waste management and community-led initiatives. I will be an advocate for maintaining the amenity, serenity, and heritage of the hills. I am passionate about succession planning as I want future generations to have the same character-defining community experiences that continue to be so important to me.
I live in Ranges Ward
Contact Details: georgiemc123 @hotmail.com
I am not a member of a Political Party

TRANTER, Jenn
I have helped raise two compassionate and emotionally intelligent young women and have worked as a teacher and educational counsellor for over 30 years, including in local schools. I am a skilled listener and enjoy empowering others through advocacy and support for their voices to be heard. I plan to further develop links with community groups and activities across the council that help build connections for all. I have been an executive member of the Morialta Residents’ Association for over 20 years and am actively involved in maintaining our excellent relationship with AHC to preserve the environment and our healthy, peaceful lifestyle. We can’t necessarily change the world, but we can work together to make our little part of it as wonderful as possible! I am really happy to be contacted by phone or email, and I also enjoy a coffee and a chat! I take responsibility for the content of this profile. I live in the ward. Jenn Tranter 20 Baroota Avenue Rostrevor 5073 SA
I live in Ranges Ward
Contact Details: jenntr500 @gmail.com
I am a member of Australian Greens SA
CUTHBERTSON, Mark
I grew up in Teringie, played Hills footy, and our family has owned land here for over 75 years. After time overseas in Corporate and Institutional Banking and another Corporate Institution, I returned with my family as we love this area and Adelaide Hills is home. Like many locals, I'm concerned about increases in council expenses and ratepayer costs. My primary focus will be on basic essential services like roads and rubbish. I want my family and others to enjoy the same love for the Hills. I'm not running for council to build a political career. I'm here to serve, listen, ask hard questions, make difficult decisions, deliver better outcomes for residents and rate payers. Using my experience in banking, accounting, and financial reporting, I bring financial discipline, and measured and practical approach, and genuine independent expertise. I'll stand independently and guided by community priorities, not external agendas or political trends.
I live in Ranges Ward
Contact Details: imcuthbert @yahoo.com
I am a member of the Liberal Party of Australia (SA Division)
SADLER, James Grant
James Sadler is committed to being a voice for the community, from the community. I believe leadership begins with listening to the concerns, hopes, and needs of everyday people. And with the responsibility to listen comes the councillor’s responsibility to provide clear, honest communication with the community about what’s happening in the region and in wider society. I will work side by side with locals to shape practical, values-driven policies that make a real difference. I’ll be visible, accessible, and accountable ready to lead with integrity, grounded in facts, and always open to dialogue. From improving services and strengthening communities to supporting families and small businesses, I will never stop listening, never stop leading, and never stop serving and working towards a future shaped with and for all of us in the Adelaide Hills.
I live in Ranges Ward
Contact Details: sadler_james @hotmail.com
I am not a member of a Political Party

De'ATH, James
I believe that enhancing the lifestyle of people living in the Adelaide Hills is something council should put ahead of corporate interests. Being active in local community development, sport, community music events and not aligned to any political organisation, business or religious group, I recognise that our natural environment, water quality and soil health to be at the heart of all our wellbeing. I aim to support the core services of our council that serve to keep public spaces accessible, sustainable, safe and enjoyable, while reducing expenditure on unnecessary regulation and enforcement. I aim to help keep our rates as low as possible by supporting residents and businesses to share responsibility for the sustainable maintenance of public footpaths and roadsides.
I live in Ranges Ward
Contact Details: jmsdth @gmail.com
I am not a member of a Political Party
Campaign Donation Return 1
Campaign Donation Return 2
Count Summary
The scrutiny and count were conducted on Tuesday 23 September 2025.
| Enrolled electors | 20,907 |
|---|---|
| Envelopes returned | 6,540 (31.28% return rate) |
| Envelopes accepted | 6,402 |
| Envelopes rejected | 138 |
| Declaration envelopes excluded upon opening | 4 |
| Voter participation* | 30.6% of the total enrolment |
| Formal votes | 6,373 |
| Informal votes | 25 |
| Quota | 3,187 |
* Participation is calculated as the number of formal and informal votes counted as a percentage of the number of enrolled electors
Results
| Candidate | First preference votes | Percent | Votes at Exclusion / Election | Elected or Excluded |
| SHANKS, Nathan | 2,955 | 46.37% | 3,259 | ELECTED |
| DAVIES, Cody | 2,805 | 44.01% | 2,932 | |
| LITTLE, Paul Robert | 613 | 9.62% | 613 | Excluded |
| Total | 6,373 |
Outcome of the election
After the distribution of preferences, Nathan SHANKS obtained 3,259 votes and was declared elected over quota at 05:15pm on Tuesday 23 September 2025.
To view the distribution of votes refer to the scrutiny sheet.
Daily Returns
| Event | Legislation* | Date |
|
Close of rolls |
s 6(7)(a), s 15(9)(b) |
5pm, Monday 30 June 2025 |
|
Nominations open |
s 19(4) |
Thursday 24 July 2025 |
|
Nominations close |
s 23(b) |
12 noon, Thursday 7 August 2025 |
|
Draw for positions on the ballot paper |
s 29(3)(b) |
as soon as practicable after 12 noon, Thursday 7 August 2025 Link to live draw https://www.youtube.com/live/5kCJcTQd2js |
|
First campaign donation return due |
s 80(3)(a)(ii) | Friday 15 August 2025 to Thursday 21 August 2025 |
|
Mailout of materials |
s 39(1) |
Tuesday 26 August 2025 to Monday 1 September 2025 |
|
Last day for re-issue of voting materials |
s 39(4), s 43(4) |
5pm, Monday 15 September 2025 |
|
Close of voting (polling day) |
s 6(6), s 6(7)(b) |
12 noon, Monday 22 September 2025 |
|
Scrutiny and count |
s 47(1)(a) |
Tuesday 23 September 2025 |
| Second campaign donation return due | s 80(3)(b) |
Within 30 days of the 'conclusion of the election' |
* Local Government (Elections) Act 1999
Enrolment
If you are correctly enrolled for state elections in South Australia, you are automatically included on the council voters roll and will receive ballot papers through the post.
If you need to check or update your enrolment for future elections, you can choose one of the following options:
- Check my enrolment
- Enrol online (first time voters or to get back on the roll)
- Update my details online (for updates to your address, name or other contact details)
Council supplementary roll
If you are not enrolled on the state electoral roll you may be eligible to register on the council supplementary roll if you are:
- a resident or a non-Australian citizen who has lived at your residential address for one month or more
- an owner of an organisation or business
- an owner of a holiday home
- a sole owner, or group of owners, of a rateable property
- a sole occupier, or group of occupiers, of a rateable property
- a landlord of rateable property.
In accordance with section 15(5a) of the Local Government (Elections) Act 1999, council must purge the council's supplementary roll on 1 January of every election year. Therefore, all landlords, organisations, business owners or occupiers, and resident non-Australian citizens, must re-enrol from January 1 of every election year to be eligible to vote, with the exception of the City of Adelaide.
If you are unsure whether you are enrolled on the council supplementary roll, contact your local council.
Candidate information and regulations
Visit our Candidate section for more information about;
- Acts and Regulations
- Candidate eligibility and ineligibility
- Candidate disclosure returns
- Candidate responsibilities
- Electoral advertising
- Forms and handbooks
- Responsibilities as a member of a council.
* More information for Candidates
CANDIDATE PORTAL ACCESS (link to external website)
Due to the high volume of supplementary election events scheduled for September, our candidate portal is currently unable to accommodate individual Council names. As a result, we have opted to use the generic label "September 2025 Supplementary Elections" on the portal’s landing page. Candidates wishing to nominate will select this option, after which they can proceed to nominate within their respective election.
List of candidates
In accordance with the Local Government (Elections) Act 1999, the draw to determine the order of candidate names to appear on the ballot paper was held on Thursday 7 August 2025. The result of the draw are detailed below.

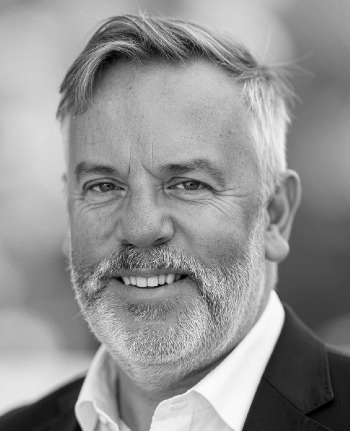
SHANKS, Nathan
I am a father, husband, builder & Acting Mayor of Gawler. I first ran for council in 2018 as a ratepayer, frustrated about council processes. Fast forward to now & I’ve been honoured to play a pivotal role toward a fresh council. We have a new CEO, new culture & new energy around the council table. As well as new relationships with our neighbouring councils & different levels of government, something I have been working very hard on behind the scenes. I’m running for Mayor not for the title but because as a leader I know how to get things done & I’m not afraid to roll up my sleeves. I don’t pretend to have all the answers but I do bring a practical mindset, a thick skin & a genuine love for this town. No nonsense, just honest work. I would love to keep building toward a better Gawler. Build much needed infrastructure, build important relationships & work alongside the groups, clubs & businesses that build a strong sense of community. With your help we can build a better Gawler.
I live in the area
Contact Details: 0447 680 779
I am not a member of a Political Party

DAVIES, Cody
I believe that a more connected community is a stronger community. That is why I put in the effort, every day, to communicate with Gawler residents, which I have done long before this by-election was called. At a time when our region is growing fast, it is vital that the mayor, as the Council’s official chief spokesperson, is somebody who can bring the community together by informing them and engaging them. I am 35 years old with six years of experience on Council, including a year as Deputy Mayor. I have spent over 15 years operating in fields such as media, social media, journalism, and community management, which I would like to utilise to promote and strengthen the culture of our beautiful town. If you’ve read this far, then you care about being informed on local issues, so why not take that final step and vote!
I live in the area
Contact Details: codydaviesforcouncil @gmail.com
I am a member of the Australian Labor Party (South Australian Branch)

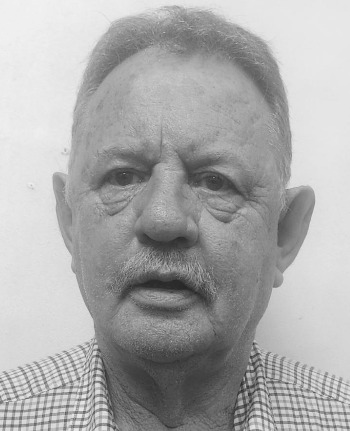
LITTLE, Paul Robert
I wish to introduce myself. Paul Robert Little OAM J.P. I have been elected several times before to council. I am a returned soldier and a retired Police Officer have had many roles in the Town of Gawler, director Hospital Board, a volunteer driver for the Hospital, and five years as a director of the Barossa loght and Gawler Football League. As a retired person I am well aware of the pressures on budgets on any rate increases. Please place me first on the ballot.
I live in the area
Contact Details: pr.little @outlook.com
I am not a member of a Political Party
Count Summary
The scrutiny and count were conducted on Tuesday 23 September 2025.
| Enrolled electors | 3,864 |
|---|---|
| Envelopes returned | 1,057 (27.36% return rate) |
| Envelopes accepted | 1,044 |
| Envelopes rejected | 13 |
| Declaration envelopes excluded upon opening | 1 |
| Voter participation* | 26.99% of the total enrolment |
| Formal votes | 1,038 |
| Informal votes | 5 |
| Quota | 520 |
* Participation is calculated as the number of formal and informal votes counted as a percentage of the number of enrolled electors
Results
| Candidate | First preference votes | Percent | Votes at Exclusion / Election | Elected or Excluded |
| RAKSHIT, Rima | 18 | 1.73% | 18 | Excluded |
| CAVENEY, Ben | 20 | 1.93% | 30 | Excluded |
| YOUNG, Zane | 97 | 9.34% | 111 | Excluded |
| EXCELL, Rita | 327 | 31.5% | 495 | ELECTED |
| GOODE, Matthew | 203 | 19.56% | 305 | |
| CHENOWETH, Spencer | 191 | 18.4% | 227 | Excluded |
| GRAHAM, Patrick Litchfield | 158 | 15.22% | 180 | Excluded |
| KUSHNIR, Julienne | 24 | 2.31% | 25 | Excluded |
| Total | 1,038 |
Outcome of the election
After the distribution of preferences, Rita EXCELL obtained 495 votes and was declared elected under quota at 03:22pm on Tuesday 23 September 2025.
To view the distribution of votes refer to the scrutiny sheet.
Daily Returns
| Event | Legislation* | Date |
|
Close of rolls |
s 6(7)(a), s 15(9)(b) |
5pm, Monday 30 June 2025 |
|
Nominations open |
s 19(4) |
Thursday 24 July 2025 |
|
Nominations close |
s 23(b) |
12 noon, Thursday 7 August 2025 |
|
Draw for positions on the ballot paper |
s 29(3)(b) |
as soon as practicable after 12 noon, Thursday 7 August 2025 Link to live draw https://www.youtube.com/live/5kCJcTQd2js |
|
First campaign donation return due |
s 80(3)(a)(ii) | Friday 15 August 2025 to Thursday 21 August 2025 |
|
Mailout of materials |
s 39(1) |
Tuesday 26 August 2025 to Monday 1 September 2025 |
|
Last day for re-issue of voting materials |
s 39(4), s 43(4) |
5pm, Monday 15 September 2025 |
|
Close of voting (polling day) |
s 6(6), s 6(7)(b) |
12 noon, Monday 22 September 2025 |
|
Scrutiny and count |
s 47(1)(a) |
Tuesday 23 September 2025 |
| Second campaign donation return due | s 80(3)(b) |
Within 30 days of the 'conclusion of the election' |
* Local Government (Elections) Act 1999
Enrolment
If you are correctly enrolled for state elections in South Australia, you are automatically included on the council voters roll and will receive ballot papers through the post.
If you need to check or update your enrolment for future elections, you can choose one of the following options:
- Check my enrolment
- Enrol online (first time voters or to get back on the roll)
- Update my details online (for updates to your address, name or other contact details)
Council supplementary roll
If you are not enrolled on the state electoral roll you may be eligible to register on the council supplementary roll if you are:
- a resident or a non-Australian citizen who has lived at your residential address for one month or more
- an owner of an organisation or business
- an owner of a holiday home
- a sole owner, or group of owners, of a rateable property
- a sole occupier, or group of occupiers, of a rateable property
- a landlord of rateable property.
In accordance with section 15(5a) of the Local Government (Elections) Act 1999, council must purge the council's supplementary roll on 1 January of every election year. Therefore, all landlords, organisations, business owners or occupiers, and resident non-Australian citizens, must re-enrol from January 1 of every election year to be eligible to vote, with the exception of the City of Adelaide.
If you are unsure whether you are enrolled on the council supplementary roll, contact your local council.
Candidate information and regulations
Visit our Candidate section for more information about;
- Acts and Regulations
- Candidate eligibility and ineligibility
- Candidate disclosure returns
- Candidate responsibilities
- Electoral advertising
- Forms and handbooks
- Responsibilities as a member of a council.
CANDIDATE PORTAL ACCESS (link to external website)
Due to the high volume of supplementary election events scheduled for September, our candidate portal is currently unable to accommodate individual Council names. As a result, we have opted to use the generic label "September 2025 Supplementary Elections" on the portal’s landing page. Candidates wishing to nominate will select this option, after which they can proceed to nominate within their respective election.
List of candidates
In accordance with the Local Government (Elections) Act 1999, the draw to determine the order of candidate names to appear on the ballot paper was held on Thursday 7 August 2025. The result of the draw are detailed below. Disclaimer; Candidate information is accurate as of the date of publication and will remain unchanged until archived.
RAKSHIT, Rima
I am resident of Norwood , I am a mental health practitioner and social worker . I have experience working with diverse population and is involved in the community services .I want to be part of council to make changes . I am also part of the eastern advisory panel.
I do not live in St Peters Ward
Contact Details: reema431 @gmail.com
I am not a member of a Political Party
CAVENEY, Ben
Hi, I’m Ben Caveney. Running for city council with these goals: Keep Our Community Safe: Prioritize security and well-being. Reduce Loneliness: Strengthen community bonds and support programs. Maintain Council Surplus: Ensure fiscal responsibility. Protect Green Spaces: Preserve our natural environments. I’m an accounting student committed to balancing social wellbeing with financial health. Vote for practical solutions that enhance safety, reduce loneliness, maintain financial stability, and protect green areas. For further information go to my website https://bencaveney.my.canva.site/
I do not live in St Peters Ward
Contact Details: BenjaminCaveney @outlook.com
I am not a member of a Political Party

YOUNG, Zane
You don’t live in Norwood, and you don’t live in Payneham. St Peters deserves a bold, passionate, experienced voice. Who can genuinely stand up for this community and who is not beholden to any voting group. My priorities are: safer streets through modern streetscape design, preserving and growing our tree canopy, heritage protection with a balanced development plan, responsible financial decisions to keep rates under control, and our libraries and community facilities. You don’t have to take my word for it. As an elected member at Mitcham 2006-2010, I worked closely with other members Liberal, Labor, and independent, and proudly achieved: preservation of mature street trees and local heritage, solar panels on Council buildings, transition to a hybrid vehicle fleet, workable cat registration, more sensitive tree-trimming under power lines, and safe cycling corridors There are 12 months until the next Council election. It’s a crucial time to modernise and refresh our Council.
I live in St Peters Ward
Contact Details: npsp @zaneyoung.com
I am a member of Australian Greens SA
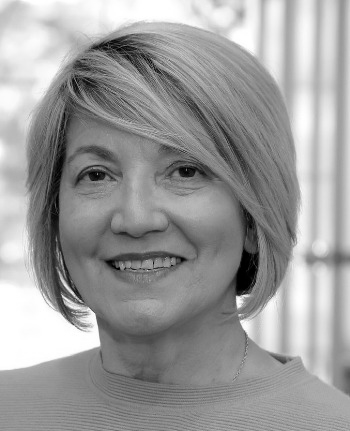
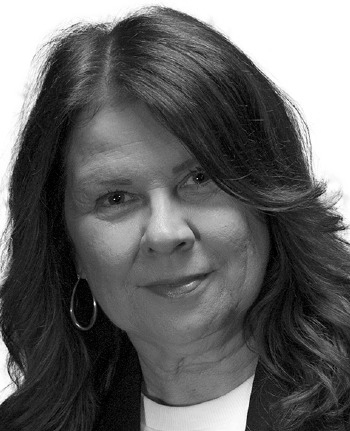
EXCELL, Rita
As a long-term local resident of the St Peters Ward, I am passionate about service to our local community and ensuring that our voices are heard. I understand that challenges for local residents are as diverse as the finding solutions for our local streets, that are being used for all day parking and to avoid Payneham Road; through to the delivery of sustainable services for our community and protecting our local environment. As a practicing civil engineer with over 30 years’ experience in traffic, stormwater and sustainable planning, as well as being a volunteer at my local Catholic parish and Friends of the Billabong, I am asking for your support to be your voice in St Peters Ward. I have brought my family up in this area and care deeply about what you care about; smart spending, sustainability, safe streets, responsible development and thoughtful growth. Call 0404 049 760 or email rita.excell @icloud.com
I live in St Peters Ward
Contact Details: rita.excell @icloud.com
I am not a member of a Political Party
GOODE, Matthew
I have been a resident of St Peters since 1976, so I know the area very well indeed. I live at the river end of Winchester Street. My son went to Hackney Kindergarten and East Adelaide Primary. I am an Adjunct Associate Professor of Law at what is now Adelaide University. I work part time as a consultant at the Office of the Director of Public Prosecutions. I worked for the the South Australian Attorney-General in a senior position for over 20 years. At that time I specialised in legislation to deal with terrorism and organised crime. I volunteer at a religious tolerance programme for schools. Between 1982 and 1997 I was an elected member of the then St Peters Council. I was Mayor between 1987 and 1991. I invented the Local Government Mutual Liability insurance scheme which saved local government millions in insurance premiums. I was a director of the local government Council Purchasing Authority Pty Ltd. I was heavily involved in planning issues. Contact at mrgoode @0ptusnet.com.au
I live in St Peters Ward
Contact Details: mrgoode @optusnet.com.au
I am a member of the Australian Labor Party (South Australian Branch)
CHENOWETH, Spencer
I’m standing for Council because, as a proud Joslin resident who has lived here most of my life, I care deeply about our future, and I want to preserve what makes our area so special. As a Law Student working in a Community Engagement role, I bring extensive professional experience in delivering positive outcomes for residents. If elected to represent the St Peters Ward, I’ll prioritise upgrading lighting and streetscapes to improve safety, accessibility, and the overall appeal of our neighbourhood. I’ll champion the protection and restoration of our local environment and heritage. I’ll push for fair, reasonable rates that deliver real value for money. I believe that Council should be open, transparent, and people-focused with better outreach to all, especially to elderly residents and community groups who are too often left unheard. Your voice matters, and I am committed to listening and making it heard in the Town Hall.
I live in St Peters Ward
Contact Details: spencerforstpeters @outlook.com
I am a member of the Liberal Party of Australia (SA Division)

GRAHAM, Patrick Litchfield
Patrick is a fresh face, unaffiliated with any party, committed to listening to residents and representing them with fresh energy. His priorities are fiscal responsibility, addressing rate rises by increasing council revenue through sourcing grants, collaborating with business, nearby councils, and other levels of government. A lifelong local, his family has lived in the area for 40 years. He was Deputy Head Boy at Pembroke while playing for Norwood and league for Sturt. His studies in Science, Law, and Arts, gave Patrick the ability to co-found Switch Productions, his work earning significant acclaim. Producing the only Australian film to win a Silver Bear at Berlinale that also qualified for the '24 Oscars. He teaches film and acting locally. Patrick brings a much-needed new perspective focused on people and delivering positive change. If elected, he’ll ensure ratepayers are heard, promote good governance, protect heritage, and maintain the vitality and beauty of the St Peters Ward.
I live in St Peters Ward
Contact Details: Patrick @switchproductions.com.au
I am not a member of a Political Party
KUSHNIR, Julienne
With a long and respected career in marketing and communications, I have always been passionate about initiatives that strengthen local economies and help them thrive. My motivation stems from a genuine commitment to supporting people and businesses in ways that create lasting, positive change. I have held senior roles in local and state government as well as the private sector. Stepping away from full-time work, I now have time and energy to focus on council responsibilities. I have been a resident of the council area for 30 years and value the heritage and character of our region, while recognising the importance of balancing this with the needs of a growing, progressive community. We are fortunate to have a vibrant business community that deserves strong support to stay relevant. Our parks reflect the lifestyle and environmental values we all share and must continue to protect. Facebook site: Julienne Kushnir for City of Norwood, Payneham & St Peters or email JAKushnir @gmail.com
I do not live in St Peters Ward
Contact Details: JAKushnir @gmail.com
I am not a member of a Political Party