Elections
Count Summary
The scrutiny and count were conducted on Tuesday 10 February 2026.
| Enrolled electors | 3,431 |
|---|---|
| Envelopes returned | 1,268 (36.96% return rate) |
| Envelopes accepted | 1,243 |
| Envelopes rejected | 25 |
| Declaration envelopes excluded upon opening | 1 |
| Voter participation* | 36.2% of the total enrolment |
| Formal votes | 1,240 |
| Informal votes | 2 |
| Quota | 621 |
* Participation is calculated as the number of formal and informal votes counted as a percentage of the number of enrolled electors
Results
| Candidate | First preference votes | Percent | Votes at Exclusion / Election | Elected or Excluded |
| GLAZBROOK, William | 719 | 57.98% | 719 | ELECTED |
| DINHAM, Phil | 521 | 42.02% | 521 | |
| Total | 1,240 |
Outcome of the election
As William GLAZBROOK obtained 719 first preference votes, they were provisionally declared elected over quota at 12:41pm on Tuesday 10 February 2026.
To view the distribution of votes refer to < scrutiny sheet here >
Daily Returns
Key Dates
| Event | Legislation* | Date |
|
Close of rolls |
s 6(7)(a), s 15(9)(b) |
5pm on Friday, 31 October 2025 |
|
Nominations open |
s 19(4) |
Thursday, 20 November 2025 |
|
Nominations close |
s 23(b) |
12 noon on Thursday, 4 December 2025 |
|
Draw for positions on the ballot paper |
s 29(3)(b) |
as soon as practicable after 12 noon on Thursday, 4 December 2025 *YouTube live link : https://www.youtube.com/live/403Uuil1Qys |
| Dispatch of ballot material to electors | s39(1) |
Tuesday 13 January 2026 to Monday 19 January 2026 |
| Telephone assisted voting dates of operation |
9am – 5pm, Thursday 5 February 2026 9am – 5pm, Friday 6 February 2026 9am – 12pm, Monday 9 February 2026 |
|
| Last day and time for re-issue of ballot material |
[ss 39(4) and 43(4)] |
5pm, Monday 2 February 2026 |
|
Close of voting (polling day) |
s 6(6), s 6(7)(b) |
Monday, 9 February 2026 |
| Scrutiny and Count | s47(1)(a) | Tuesday 10 February 2026 |
| Second campaign donation return due | s 80(3)(b) |
Within 30 days of the 'conclusion of the election' |
* Local Government (Elections) Act 1999
Candidate information and regulations
Visit our Candidate section for more information about;
- Acts and Regulations
- Candidate eligibility and ineligibility
- Candidate disclosure returns
- Candidate responsibilities
- Electoral advertising
- Forms and handbooks
- Responsibilities as a member of a council.
List of candidates
In accordance with the Local Government (Elections) Act 1999, the draw to determine the order of candidate names to appear on the ballot paper has been held. The result of the draw are detailed:
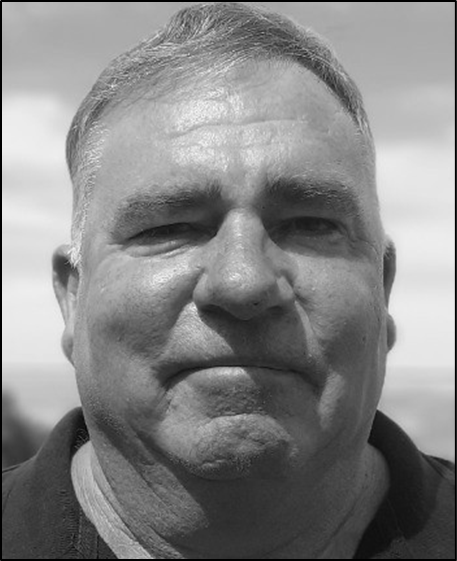
GLAZBROOK, William
Focused on growth, driven by community! As a proud Stansbury local with more than 15 years working and living on the Yorke Peninsula, I’m passionate about strengthening the communities that make our region unique. With extensive experience in hospitality and as a local business owner, I understand both the opportunities and challenges we face. I volunteer with and sponsor several local sporting clubs, serve as Chairperson of the Stansbury Primary School Governing Council, and am an active member of the Stansbury Progress Association. If elected, I’ll focus on growing tourism, improving local infrastructure, and supporting events that bring people together. I’m committed to being an approachable, dedicated representative who works collaboratively to ensure the Yorke Peninsula continues to thrive for generations to come.
I live in Innes/Penton Vale Ward
Contact Details: william.glazbrook @me.com
I am not a member of a Political Party
Campaign Donation Return 1
Campaign Donation Return 2
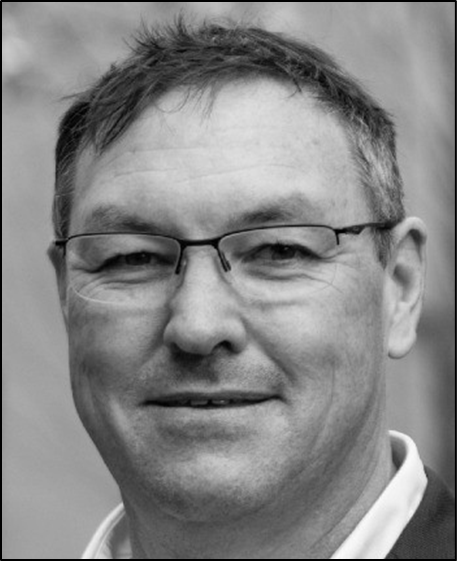
DINHAM, Phil
Having holidayed on the Yorke Peninsula for the past 50 years & now calling Point Turton home for the last 8 years, I've developed a strong connection to this region. My family has owned a holiday house here for half a century, and I have a deep appreciation for the local community, environment, and way of life. I bring a wealth of experience from 17 years with the Adelaide City Council, where I worked across parkland & garden maintenance, as well as road, footpath, & stormwater drainage construction. I also succsessfully ran my own small, specialised transport bussiness for 24 years, giving me strong skills in planning, fiances, problem-solving, & customer service. Additionally, I have worked in the civil construction industry at various times. I take a keen interest in the environment, agriculture, & small business-key pillars of our community. As a councillor, my focus would be on enhancing amenities for all ratepayers, including residents, farmers, small business, & sportig clubs.
I live in Innes/Penton Vale Ward
Contact Details: pdinham@ bigpond.net.au
I am not a member of a Political Party

Count Summaries
Scrutiny and count was conducted on Wednesday 30 April 2025.
| Enrolled voters | 2,135 |
|---|---|
| Envelopes returned | 914 |
| Envelopes accepted | 893 |
| Envelopes rejected | 21 |
| Declaration envelopes excluded upon opening | 1 |
| Voter participation | 42.81% of the total enrolment |
| Formal votes | 885 |
| Informal votes | 7 |
| Quota | 443 |
Details of the vote count
| Candidate | First preference votes | Percent | Votes at Exclusion / Election | Elected or Excluded |
| BAYLY, Bruce Benjamin | 518 | 58.53% | 518 | ELECTED |
| RANDALL, Robert | 367 | 41.47% | 367 | |
| Total | 885 |
As Bruce Benjamin BAYLY obtained a number of first preference votes greater than the quota of 443 and was declared elected, at 3:36pm on Wednesday 30 April 2025.
To view the distribution of votes refer to the scrutiny sheet.
Daily Returns
Timetable
* Local Government (Elections) Act 1999
Enrolment
If you are correctly enrolled for state elections in South Australia, you are automatically included on the council voters roll and will receive ballot papers through the post.
If you need to check or update your enrolment for future elections, you can choose one of the following options:
- Check my enrolment
- Enrol online (first time voters or to get back on the roll)
- Update my details online (for updates to your address, name or other contact details)
Council supplementary roll
If you are not enrolled on the state electoral roll you may be eligible to register on the council supplementary roll if you are:
- a resident or a non-Australian citizen who has lived at your residential address for one month or more
- an owner of an organisation or business
- an owner of a holiday home
- a sole owner, or group of owners, of a rateable property
- a sole occupier, or group of occupiers, of a rateable property
- a landlord of rateable property.
In accordance with section 15(5a) of the Local Government (Elections) Act 1999, council must purge the council's supplementary roll on 1 January of every election year. Therefore, all landlords, organisations, business owners or occupiers, and resident non-Australian citizens, must re-enrol from January 1 of every election year to be eligible to vote, with the exception of the City of Adelaide.
If you are unsure whether you are enrolled on the council supplementary roll, contact your local council.
Candidate information and regulations
Visit our Candidate section for more information about;
- Acts and Regulations
- Candidate eligibility and ineligibility
- Candidate disclosure returns
- Candidate responsibilities
- Electoral advertising
- Forms and handbooks
- Responsibilities as a member of a council.
* More information for Candidates
CANDIDATE PORTAL (opened Thursday 27 February)
List of candidates
In accordance with the Local Government (Elections) Act 1999, the draw to determine the order of candidate names to appear on the ballot paper was held on Thursday 13 March 2025. The result of the draw are detailed below.
District Council of Tumby Bay Area Councillor
BAYLY, Bruce Benjamin
Mr Bruce Bayly is a community minded individual who was born in Murray Bridge, and raised around the South East of South Australia, (predominantely Bordertown region). Bruce is a 'country-kid' at heart. Residing in a number of small-medium communities, including Kaniva, Western Victoria, where he operated his own successful small business of waste management/ recycling operations. Bruce also undertook most of his schooling in at Kaniva. Bruce values life-experience as an important learning tool, as well as his schooling & education. Bruce is part owner of his own small business in Tumby Bay and is very proud of his contribution thus far to this special part of South Australia's Eyre Penninsula. Bruce is hopeful to continue his 16 years of dedication to SES in the near future.He is very passionate to deliver real results to the local Tumby Bay Disctrict Council community. He has previous experience within local government, albeit in Western Victoria, where he was active in his community.
I live in the area
Contact Details: transferstations @live.com.au
I am not a member of a Political Party
RANDALL, Robert
For more than 30 years I have worked as a volunteer or served as an elected member in the community where I live. My election as a Councillor, Deputy Mayor, Mayor and state Member of Parliament has provided me with a wide range of valuable experience. Working on foreshore projects such as revamping of Henley Square into what it is today or protecting coastal sand dunes from erosion is some of the experience that I can offer you as I request your support for election to the vacant Councillor position. Council finances are also especially important. An openness and transparency in the decisions we take using ratepayer funds (your money) has always been important for me. Accountability to the people that I represent, can be achieved by providing as much information as possible, individually by email and newsletters or at public meetings. I will always endeavor to do that. Representation should be non-partisan and be open to free and frank debate. This is when the best decisions are made.
I live in the area
Contact Details: robertrandall47 @gmail.com
I am a member of the Liberal Party of Australia (SA Division)
Count Summaries
Scrutiny and count was conducted on Wednesday 30 April 2025.
| Enrolled voters | 3,320 |
|---|---|
| Envelopes returned | 1,310 |
| Envelopes accepted | 1,288 |
| Envelopes rejected | 22 |
| Declaration envelopes excluded upon opening | 2 |
| Voter participation | 39.46% of the total enrolment |
| Formal votes | 1,279 |
| Informal votes | 7 |
| Quota | 640 |
Details of the vote count
| Candidate | First preference votes | Percent | Votes at Exclusion / Election | Elected or Excluded |
| DINHAM, Phil | 84 | 6.57% | 84 | Excluded |
| GUNNING, Richard | 383 | 29.95% | 519 | |
| LE FEUVRE, Danny | 500 | 39.09% | 624 | ELECTED |
| HONNER, Meg | 312 | 24.39% | 331 | Excluded |
| Total | 1,279 |
After the distribution of preferences Danny LE FEUVRE obtained 624 votes and was provisionally declared elected under quota, at 12:23pm on Wednesday 30 April 2025.
To view the distribution of votes refer to the scrutiny sheet.
Daily Returns
Timetable
* Local Government (Elections) Act 1999
Enrolment
If you are correctly enrolled for state elections in South Australia, you are automatically included on the council voters roll and will receive ballot papers through the post.
If you need to check or update your enrolment for future elections, you can choose one of the following options:
- Check my enrolment
- Enrol online (first time voters or to get back on the roll)
- Update my details online (for updates to your address, name or other contact details)
Council supplementary roll
If you are not enrolled on the state electoral roll you may be eligible to register on the council supplementary roll if you are:
- a resident or a non-Australian citizen who has lived at your residential address for one month or more
- an owner of an organisation or business
- an owner of a holiday home
- a sole owner, or group of owners, of a rateable property
- a sole occupier, or group of occupiers, of a rateable property
- a landlord of rateable property.
In accordance with section 15(5a) of the Local Government (Elections) Act 1999, council must purge the council's supplementary roll on 1 January of every election year. Therefore, all landlords, organisations, business owners or occupiers, and resident non-Australian citizens, must re-enrol from January 1 of every election year to be eligible to vote, with the exception of the City of Adelaide.
If you are unsure whether you are enrolled on the council supplementary roll, contact your local council.
Candidate information and regulations
Visit our Candidate section for more information about;
- Acts and Regulations
- Candidate eligibility and ineligibility
- Candidate disclosure returns
- Candidate responsibilities
- Electoral advertising
- Forms and handbooks
- Responsibilities as a member of a council.
* More information for Candidates
CANDIDATE PORTAL (opened Thursday 27 February)
List of candidates
In accordance with the Local Government (Elections) Act 1999, the draw to determine the order of candidate names to appear on the ballot paper was held on 13 March 2025. The result of the draw are detailed below.
Yorke Peninsula Council - Kalkabury ward
DINHAM, Phil
Having holidayed on the Yorke Peninsula for the past 50 years and now calling Point Turton home for the last seven, I've a strong connection to this region. I have a deep appreciation for the local community, environment, and way of life. I bring a wealth of experience from 17 years with the Adelaide City Council, where I worked across parkland and garden maintenance, as well as road, footpath and stormwater drainage construction. I also successfully ran my own small, specialised transport business for 24 years, giving me strong skills in planning, finances, problem-solving and customer service. Additionally, I have worked in the civil construction industry at various times. I take a keen interest in the environment, agriculture, and small business - key pillars of our community. As a councillor, my focus would be on enhancing amenities for all rate payers, including residents, farmers, small businesses, sporting oranisations, and, importantly, the younger generation.
I do not live in Kalkabury Ward
Contact Details: pdinham @bigpond. net.au
I am not a member of a Political Party

GUNNING, Richard
I have lived and worked in Maitland my whole adult life. I have previously served two terms as a councillor when it was just the Central Yorke Council. I didn’t re nominate when amalgamation occurred with the Southern Yorke Peninsula council; also as my family and work committents took precedence. I have recently sold my business which I successfully operated for fifty years. I now have the time and knowledge to be able to assist in the operations of the council.
I live in Kalkabury Ward
Contact Details: richard @yorkeauto. com.au
I am not a member of a Political Party
LE FEUVRE, Danny
I have called Ardrossan home for the past 22 years. Along with my wife and son, we have been strong contributors to our local community. Across the years I have volunteered in our local football club, community events, Pt Vincent Sailing Club and our local CFS brigade. I hold a B.app sci (Melb Uni), M.agri buss (Adel Uni) and I am a graduate of the Australian Institute of Company Directors. In my professional capacity I am the CEO of the Australian Honey Bee Industry Council (national representative body for the honey bee industry) and Deputy Chair of AgriFutures Australia (a commonwealth government statutory RDC). Previous experiences have included running a small business on Yorke Peninsula for 15 years, providing research and agronomy services to the grains industry and serving on many industry volunteer boards. I am passionate about ensuring the long-term prosperity of our regional communities and ensuring the Kalkabury ward is strongly represented at council.
I live in Kalkabury Ward
Contact Details: dannybees38 @gmail.com
I am a member of the Liberal Party of Australia (SA Division)
HONNER, Meg
Being from a fifth generation family on the Yorke Peninsula I have a deep connection to both the land and the community. I’m a graphic designer and ceramic artist who works from our home in Yorke Valley. As an active member of the YP Arts and Culture Working Group I enjoy working on a team that organises events that celebrate the arts and artists of Yorke Peninsula. This year along with a small group of local women, we are organising what will be the first Rural Women’s Day event on Yorke Peninsula, celebrating rural and regional women. I’m also a member of the Maitland and District Progress Association. I strongly believe in the power of community and the value of supporting local initiatives. I’d like to make the Yorke Peninsula an even better place to live, work and ultimately prosper.
I live in Kalkabury Ward
Contact Details: meg.honner@ icloud.com
I am not a member of a Political Party
Count summaries
Scrutiny and count was conducted on Wednesday 19 March 2025.
| Enrolled voters | 13,818 |
|---|---|
| Envelopes returned | 3,291 |
| Envelopes accepted | 3,258 |
| Envelopes rejected | 33 |
| Declaration envelopes excluded upon opening | 3 |
| Voter participation | 23.82% of the total enrolment |
| Formal votes | 3,230 |
| Informal votes | 25 |
| Quota | 1,616 |
Details of the vote count
| Candidate | First preference votes | Percent | Votes at Exclusion / Election | Elected or Excluded |
| SIZE, Janette | 828 | 25.63% | 1,562 | ELECTED |
| PATHAN, Jimiur | 417 | 12.91% | 523 | Excluded |
| MALPAS, David | 476 | 14.74% | 622 | Excluded |
| DOREY, Clare | 318 | 9.85% | 361 | Excluded |
| BARLOW, Rachelle | 233 | 7.21% | 243 | Excluded |
| BOURNE, Mark | 355 | 10.99% | 404 | Excluded |
| HUGHES, Michael Shaun | 485 | 15.02% | 831 | |
| KUSUMA, Putu | 118 | 3.65% | 118 | Excluded |
| Total | 3,230 |
Results
After the distribution of preferences, Janette SIZE obtained 1562 votes and was declared elected under quota, at 12:55pm on 19 March 2025. To view the distribution of votes refer to the scrutiny sheet (pdf download).
Daily Returns
Timetable
| Event | Legislation* | Date |
|
Close of rolls |
s 6(7)(a), s 15(9)(b) |
5pm, Friday 20 December 2024 |
|
Nominations open |
s 19(4) |
Thursday 16 January 2025 |
|
Nominations close |
s 23(b) |
12 noon, Thursday 30 January 2025 |
|
Draw for positions on the ballot paper |
s 29(3)(b) |
as soon as practicable after 12 noon, Thursday 30 January 2025 |
|
First campaign donation return due |
s 80(3)(a)(ii) | Thursday 6 February 2025 to Thursday 13 February 2025 |
|
Mailout of materials |
s 39(1) |
Wednesday 19 February to Tuesday 25 February 2025 |
|
Last day for re-issue of voting materials |
s 39(4), s 43(4) |
5pm, Tuesday 11 March 2025 |
|
Close of voting (polling day) |
s 6(6), s 6(7)(b) |
12 noon, Tuesday 18 March 2025 |
|
Scrutiny and count |
s 47(1)(a) |
Wednesday 19 March 2025 |
| Second campaign donation return due | s 80(3)(b) |
Must be lodged between Wednesday 9 April 2025 to Thursday 17 April 2025 |
List of candidates
In accordance with the Local Government (Elections) Act 1999, the draw to determine the order of candidate names to appear on the ballot paper was held on Thursday 30 January 2025. The result of the draw are detailed below.
Mount Barker - Central Ward

SIZE, Janette
I am passionate about our local district, having lived, worked and raised my children (now adults) in Mt
Barker. I am deeply connected to our community through a long involvement with schools, sport and
business organisations. As a family, we have been actively involved in sport and I have always been
happy to serve on committees. I am a business owner and employer in Mt Barker. My experience in
running a successful business has equipped me with strong leadership and communication skills as
well as the ability to work effectively within a team. My financial management skills are a key strength
that I believe will contribute positively to the responsible governance of Council. I believe Council
should focus on: improving infrastructure such as roads and carparking; protecting our environment;
expanding the trail network; upgrading parks, playgrounds and recreational facilities. It is time to make
a difference. I welcome the opportunity to be a strong advocate for you and our community.
I live in Central Ward
Contact Details: janettesize@gmail.com
I am not a member of a Political Party

PATHAN, Jimiur
My name is Jimiur Pathan. I live in Central Ward. I hold a Doctor of Pharmacy (Pharm. D) and a
Bachelor of Law (LLB) in another country, and work in Mount Barker as a disability support worker. My
wife is a practicing community pharmacist in Murray Bridge. My family proudly became Australian
citizens in June 2023. I am a founding member of Multicultural Community Adelaide Hills, and raise
funds for Mount Barker Uniting Church's Hungry No More initiative. I am an active volunteer with
Mount Barker's Lions Club and with Friendship Force. I am a member of the Rotary Club, Mount
Barker, and the Adelaide Hills Dementia Carers' Social Support Group. If elected, I will advocate for
people with disabilities, the elderly, and vulnerable groups; greater multicultural involvement in Mount
Barker; preserving our environment for future generations and for hard rubbish collection in the Mount
Barker Council area. I love our diverse community. Together, we can create a stronger and brighter
future.
I live in Central Ward
Contact Details: jimiurpathan@gmail.com
I am a member of the Australian Labor Party (South Australian Branch)

MALPAS, David
My goals to represent Central Ward include, as priorities, stopping rate rises and easing cost of living
pressure, cutting unnecessary council spending and preserving Mount Barker's relaxed lifestyle
ambience. I moved to Mount Barker four years ago and see the impact of the cost of living on my
family and friends. Mount Barker is a fast growing community and we need Council to focus on
affordability for residents, while preserving our pleasant lifestyle and community ambience. I have
spent my career as a business owner living between Australia and the United States. Community
service has always been part of my life and I spent 20 years in Rotary International involved with local
and international humanitarian projects. I believe we are all better for our efforts in helping each other
and I am committed to making a difference. Feel free to reach out at david@davidmalpas.com 0421
522 009.
I live in Central Ward
Contact Details: david@davidmalpas.com
I am a member of the Liberal Party of Australia (SA Division)

DOREY, Clare
I'm an active resident of Mount Barker and am passionate about giving back to our community; my
particular desire is to see our youth reach their potential. Our children attend school locally and
participate in Scouts, youth and YCP martial arts. I have been a teacher for decades, holding
leadership positions here and interstate. Last year, I transitioned to relief teaching, allowing me to
dedicate more time to serving our region. Currently, I volunteer at church, Parkrun, as the Secretary of
our Little Athletics club, as a Venturer Scout leader and their Committee Chair. I love history and am
conducting research for the RSL & Veterans SA to honour our local WWII servicemen. With our many
parks and bike trails, Mount Barker is a wonderful place to raise a family, but I believe we can always
do better. My organisational skills will help me contribute positively to Council as we face future
challenges balancing new growth while still focusing on essentials such as roads, waste and rates.
I live in Central Ward
Contact Details: cdorey@yahoo.com
I am not a member of a Political Party

BARLOW, Rachelle
I am running for councilor of Central Ward, bringing strong communication, leadership, and community
engagement skills. As former Chair of the Mount Barker Business Group, I developed a deep
understanding and have advocated for many small businesses. I have experience raising funds,
building networks, and collaborating with stakeholders to bring community projects to life. I'm honored
to be selected as an ambassador for 2025 for Catherine House, an organisation supporting women
experiencing homelessness in South Australia. This role deepens my commitment to empowering
vulnerable members of our community. As our city grows, we must preserve the strong sense of
community and enhance the close-knit atmosphere that makes our area unique. I support
development that is balanced, respectful, thoughtful, and maintains our community spirit. As a wife,
mother, small business owner, and advocate, I'm committed to serving you. I ask for your support to
help build a bright and connected future
I do not live in Central Ward
Contact Details: rachelle@barlowbuild.com.au
I am not a member of a Political Party

BOURNE, Mark
My wife and I have called Mt Barker home for nearly 50 years and have had the privilege of serving
the community in years long past in school and sporting areas as our children were growing up. I have
witnessed Mt Barker develop from an idyllic country hub to a suburb where the infrastructure
especially traffic is struggling to keep up with housing. I believe that preserving the unique and
enviable quality of life that the hills offer should be foremost. I am committed to being fair, honest, and
strong, as your voice in local government. I don't have all the answers but I am certain that if we can
work together to listen, share ideas and understand each other, we can make this town, this life, and
our future here enjoyable for everyone, as a happy and contented you are our community's greatest
asset. I love our community and our beautiful natural landscapes. I will endeavour to enhance
community spirit, cohesiveness and advocate for everyone. I offer myself for election
I live in Central Ward
Contact Details: traks@tpg.com.au
I am not a member of a Political Party

HUGHES, Michael Shaun
An Adelaide Hills resident for 50 years (Mt barker 18 years), I obtained a Honours Degree in Science
in 1991. I work in Scientific sales, selling to Pathology, Universities and Industry in SA, Tas and NT. I
am a Proud father of three Adult Children. Played various sports in the Hills, serving as a Committee
member and Junior cricket coach for 5 years. I am great at building relationships with people from all
walks of life. Over the last 18 years many locals have complained about our council rates, which are
35-50% higher than most other councils. i.e Adelaide Hills Council, 10 min away for an $850K home is
approx. $1000 cheaper than the same value house in Mount Barker. I would like to work with council
and SA Gov, to reduce rates to fair levels. With Pop. Growth going from Approx 33K to 46K in the next
10-15 years. We can achieve this and anything else the council and community put our minds too. We
live in Gods Country and as a Council Member I will do my best to keep it that way.
I do not live in Central Ward
Contact Details: 0417 760 914
I am not a member of a Political Party
Campaign Donations Returns 1 Download

KUSUMA, Putu
Putu Kusuma, an Australian citizen of Balinese heritage, has been living in Nairne since 2010. He
brings over a decade of professional experience and strong academic credentials. As an owner of a
local small business and former intern at an esteemed not-for-profit organisation in Adelaide, he
combines business acumen with social research expertise. His platform emphasises three core
values: multiculturalism, social justice, and sustainable urban development. His leadership roles in the
Balinese Society of South Australia Inc. and volunteer work with organisations like Red Cross
demonstrate his commitment to community engagement. Putu emphasises balancing Mount Barker's
growth with preserving its character while ensuring inclusive development. His cross-cultural
background and professional experience in policy analysis and community engagement position him
to effectively represent Mount Barker's Central Ward's diverse population and address complex
challenges facing the region.
I do not live in Central Ward
Contact Details: putu.kusuma@outlook.com
I am not a member of a Political Party