Elections

Count Summaries
Scrutiny and count was conducted on Wednesday 19 March 2025.
| Enrolled voters | 3,838 |
|---|---|
| Envelopes returned | 1,251 |
| Envelopes accepted | 1,221 |
| Envelopes rejected | 30 |
| Declaration envelopes excluded upon opening | 1 |
| Voter participation | 32.60% of the total enrolment |
| Formal votes | 1,215 |
| Informal votes | 5 |
| Quota | 608 |
Details of the vote count
| Candidate | First preference votes | Percent | Votes at Exclusion / Election | Elected or Excluded |
| BYRNE, Neville Joseph | 89 | 7.33% | 89 | |
| WARHURST, Georga | 664 | 54.65% | 664 | ELECTED |
| PANNELL, Vincent | 462 | 38.02% | 462 | |
| Total | 1,215 |
Results
As Georga WARHURST obtained a number of first preference votes greater than the quota of 608 they have been declared elected, at 3:07pm on 19 March 2025. To view the distribution of votes refer to the scrutiny sheet [PDF LINK].
Daily Returns
Timetable
| Event | Legislation* | Date |
|
Close of rolls |
s 6(7)(a), s 15(9)(b) |
5 pm, Friday 20 December 2024 |
|
Nominations open |
s 19(4) |
Thursday 16 January 2025 |
|
Nominations close |
s 23(b) |
12 noon, Thursday 30 January 2025 |
|
Draw for positions on the ballot paper |
s 29(3)(b) |
as soon as practicable after 12 noon, Thursday 30 January 2025 |
|
First campaign donation return due |
s 80(3)(a)(ii) | Thursday 6 February 2025 to Thursday 13 February 2025 |
|
Mailout of materials |
s 39(1) |
Wednesday 19 February to Tuesday 25 February 2025 |
|
Last day for re-issue of voting materials |
s 39(4), s 43(4) |
5pm, Tuesday 11 March 2025 |
|
Close of voting (polling day) |
s 6(6), s 6(7)(b) |
12 noon, Tuesday 18 March 2025 |
|
Scrutiny and count |
s 47(1)(a) |
Wednesday 19 March 2025 |
| Second campaign donation return due | s 80(3)(b) |
Must be lodged between Wednesday 9 April 2025 to Thursday 17 April 2025 |
List of candidates
In accordance with the Local Government (Elections) Act 1999, the draw to determine the order of candidate names to appear on the ballot paper was held on Thursday 30 January 2025. The result of the draw are detailed below.
Mid Murray - Shearer Ward

BYRNE, Neville Joseph
I came to live on the River Murray after an 50 year association with the River; and after six years of
residency in the Mannum Waters development, I understand the challenges facing Council to balance
its expenditures within the constraints of its limited rate base and the need to become financially
sustainable. I hold executive positions with several major groups involved with activity on the River
Murray and within the Mannum Waters community; and I am currently a community representative on
Council's major strategic growth and economic committee. I have been involved in environmental and
recreation/tourism management for nearly 50 years in rural country S.A. & Victoria.My experience
could further help develop the tourism potential within a fragile environment with its Dark Sky Reserve.
I hope to ensure the Mannum Waters development plays an increasing role to the growth and
attractiveness of the Mid Murray as a tourism yet fragile environment.
I do not live in Shearer Ward
Contact Details: 0439 940 931
I am not a member of a Political Party

WARHURST, Georga
I have worked within the Local Government sector for the past 8 years. My roles have included
governance, community development, infrastructure, customer service and policy and procedures.
Having lived within the Mid Murray area most of my life and have a passion for our local community. I
enjoy volunteering for community groups and have always been involved with local sporting clubs. I
look forward to working alongside the community to help create a sustainable Council for our future
generations.
I live in Shearer Ward
Contact Details: georga.wiebrecht@outlook.com
I am not a member of a Political Party

PANNELL, Vincent
I have lived in Mannum for the last 20 years and have raised my six children and one stepson both in
town and on a small property we had. I Worked as a Lecturer at Noarlunga TAFE then Broadband
Anywhere, later bought by Aussie Broadband, and brought wireless broadband to the area. I ran the
video and computer store called The Virtual Hub until the end of the DVD hire industry. I've been an
employee, a business owner and a farmer and sometimes all three at once. The job of a councillor is
to represent the people with integrity. The key word here is represent! I would see it as my job to
represent the majority's wishes, even if I disagree with their decision. I am always looking for solutions
to problems. A councillor is not a position of power but the exact opposite it is a position of servitude. I
am just an ordinary person looking to leave a better future for my children and hopefully in doing this
make it better for every community member.
I live in Shearer Ward
Contact Details: vince.pannell@midmurrayit.com.au
I am not a member of a Political Party

Count summary
Scrutiny and count was conducted on Tuesday 4 March 2025.
| Enrolled voters | 4,583 |
|---|---|
| Envelopes returned | 1,194 |
| Envelopes accepted | 1,178 |
| Envelopes rejected | 16 |
| Voter participation | 26.05% of the total enrolment |
| Formal votes | 1,174 |
| Informal votes | 3 |
| Quota | 588 |
First preference votes
Below are the first preference votes received by the candidates in the order they appeared on the ballot paper.
| Candidate | Campaign Donations Returns 1 | Campaign Donations Returns 2 | First preference votes | Percent | Elected or Excluded |
| ESDAILE, Louisa | CDR1 | CDR2 | 284 | ||
| ROACH, Tony | CDR1 | CDR2 | 347 | Elected under quota | |
| POTOCZKY, Kirsten | CDR1 | CDR2 | 97 | Excluded | |
| MCNALLY, Joshua | CDR1 | CDR2 | 69 | Excluded | |
| WADE, Tori | CDR1 | CDR2 | 190 | Excluded | |
| WRIGHT, Emma | CDR1 | CDR2 | 135 | Excluded | |
| TIPPER, Denise | CDR1 | CDR2 | 52 | Excluded | |
| Total | 1,174 |
Distribution of preferences - Final result
After the distribution of preferences, Tony Roach was provisionally declared elected at 4:39PM on Tuesday 4 March 2025.
To view the distribution of votes refer to the scrutiny sheet.
Daily Returns
Timetable
| Event | Legislation* | Date |
|
Close of rolls |
s 6(7)(a), s 15(9)(b) |
5pm, Friday 29 November 2024 |
|
Nominations open |
s 19(4) |
Thursday 9 January 2025 |
|
Nominations close |
s 23(b) |
12 noon, Thursday 23 January 2025 |
|
Draw for positions on the ballot paper |
s 29(3)(b) |
as soon as practicable after 12 noon, Thursday 23 January 2025 |
|
First campaign donation return due |
s 80(3)(a)(ii) | Thursday 30 January 2025 to Thursday 6 February 2025 |
|
Mailout of materials |
s 39(1) |
From Tuesday 4 February 2025 |
|
Last day for re-issue of voting materials |
s 39(4), s 43(4) |
5pm, Monday 24 February 2025 |
|
Close of voting (polling day) |
s 6(6), s 6(7)(b) |
12 noon, Monday 3 March 2025 |
|
Scrutiny and count |
s 47(1)(a) |
Tuesday 4 March 2025 |
| Second campaign donation return due | s 80(3)(b) |
Within 30 days of the 'conclusion of the election' |

Count summary
Scrutiny and count was conducted on Wednesday 5 March 2025.
| Enrolled voters | 13,282 |
|---|---|
| Envelopes returned | 2,667 |
| Envelopes accepted | 2,607 |
| Envelopes rejected | 60 |
| Voter participation | 20.08% of the total enrolment |
| Formal votes | 2,606 |
| Informal votes | 24 |
| Quota | 1,292 |
First preference votes
Below are the first preference votes received by the candidates in the order they appeared on the ballot paper.
| Candidate | Campaign Donations Returns 1 | Campaign Donations Returns 2 | First preference votes | Elected or Excluded |
| DEAN, Jamie | CDR1 | CDR2 | 222 | Excluded |
| WARNER, Bradley | CDR1 | CDR2 | 417 | Excluded |
| WYLD, Damian | CDR1 | CDR2 | 658 | Not elected |
| MOORE, Sam | CDR1 | CDR2 | 332 | Excluded |
| PROLETA, Donna | CDR1 | CDR2 | 511 | ELECTED |
| BARBARO, Paul | CDR1 | CDR2 | 374 | Excluded |
| MILHENCH, Brian | CDR1 | CDR2 | 68 | Excluded |
| Total | 2,582 |
Distribution of preferences - Final result
After the distribution of preferences, Donna Proleta was provisionally declared elected at 1:13pm on Wednesday 5 March 2025.
To view the distribution of votes refer to the scrutiny sheet.
Daily Returns
Timetable
| Event | Legislation* | Date |
|
Close of rolls |
s 6(7)(a), s 15(9)(b) |
5pm, Friday 29 November 2024 |
|
Nominations open |
s 19(4) |
Thursday 9 January 2025 |
|
Nominations close |
s 23(b) |
12 noon, Thursday 23 January 2025 |
|
Draw for positions on the ballot paper |
s 29(3)(b) |
as soon as practicable after 12 noon, Thursday 23 January 2025 |
|
First campaign donation return due |
s 80(3)(a)(ii) | Thursday 30 January 2025 to Thursday 6 February 2025 |
|
Mailout of materials |
s 39(1) |
From Tuesday 4 February 2025 |
|
Last day for re-issue of voting materials |
s 39(4), s 43(4) |
5pm, Monday 24 February 2025 |
|
Close of voting (polling day) |
s 6(6), s 6(7)(b) |
12 noon, Monday 3 March 2025 |
|
Scrutiny and count |
s 47(1)(a) |
Tuesday 4 March 2025 |
| Second campaign donation return due | s 80(3)(b) |
Within 30 days of the 'conclusion of the election' |


Key dates
| Event | Date |
| Issue of writ | Wednesday 16 October 2024 |
| Nominations open | Wednesday 16 October 2024 |
| Candidate briefing session (link to original News item) | 6pm Monday 21 October 2024 (Completed) |
| Close of rolls | 5pm Monday 28 October 2024 (Closed) |
| Close of nominations (candidates endorsed by a political party) | 12 noon Wednesday 30 October 2024 |
| Close of nominations
News item: (Event at 3pm) 1 November 2024 Black by-election Declaration of nominations |
12 noon Friday 1 November 2024 |
| Early voting opens | Monday 11 November 2024 |
| Postal vote applications close | 5pm Thursday 14 November |
| Polling day (Count schedule **Election night from 6pm ) | Saturday 16 November 2024 |
| Return of writ | Thursday 28 November 2024 |
Black by-election Count Schedule
The following is a guide to the counting process schedule. Please note the timetable is subject to change, and updates will be published here. For more information visit counting the votes for the House of Assembly
| Timeline | Vote types | Count type |
|
Saturday 16 November 2024 **Election night from 6pm
|
Ordinary votes from polling booths
|
Election night counts First preferences and two-candidate preferred counts. |
|
Sunday 17 November 2024 |
No counting will occur on the Sunday following election day Preparing system requirements for declaraion counts |
|
|
Monday 18 November 2024
|
Ordinary votes from polling booths Declaration votes |
Re-check of the results from Election night Commence counting the early votes |
| Tuesday 19 November 2024 | Declaration votes | Continue counting early votes |
| Wednesday 20 November 2024 | Declaration votes | Commence counting postal votes and other declaration votes |
| Thursday 21 November 2024 until Monday 25 November 2024 |
Declaration votes
|
Postal votes still being received
|
|
Monday 25 November 2024
|
Declaration votes Full distribution of preferences |
Final postal votes received to be counted All ballot papers |
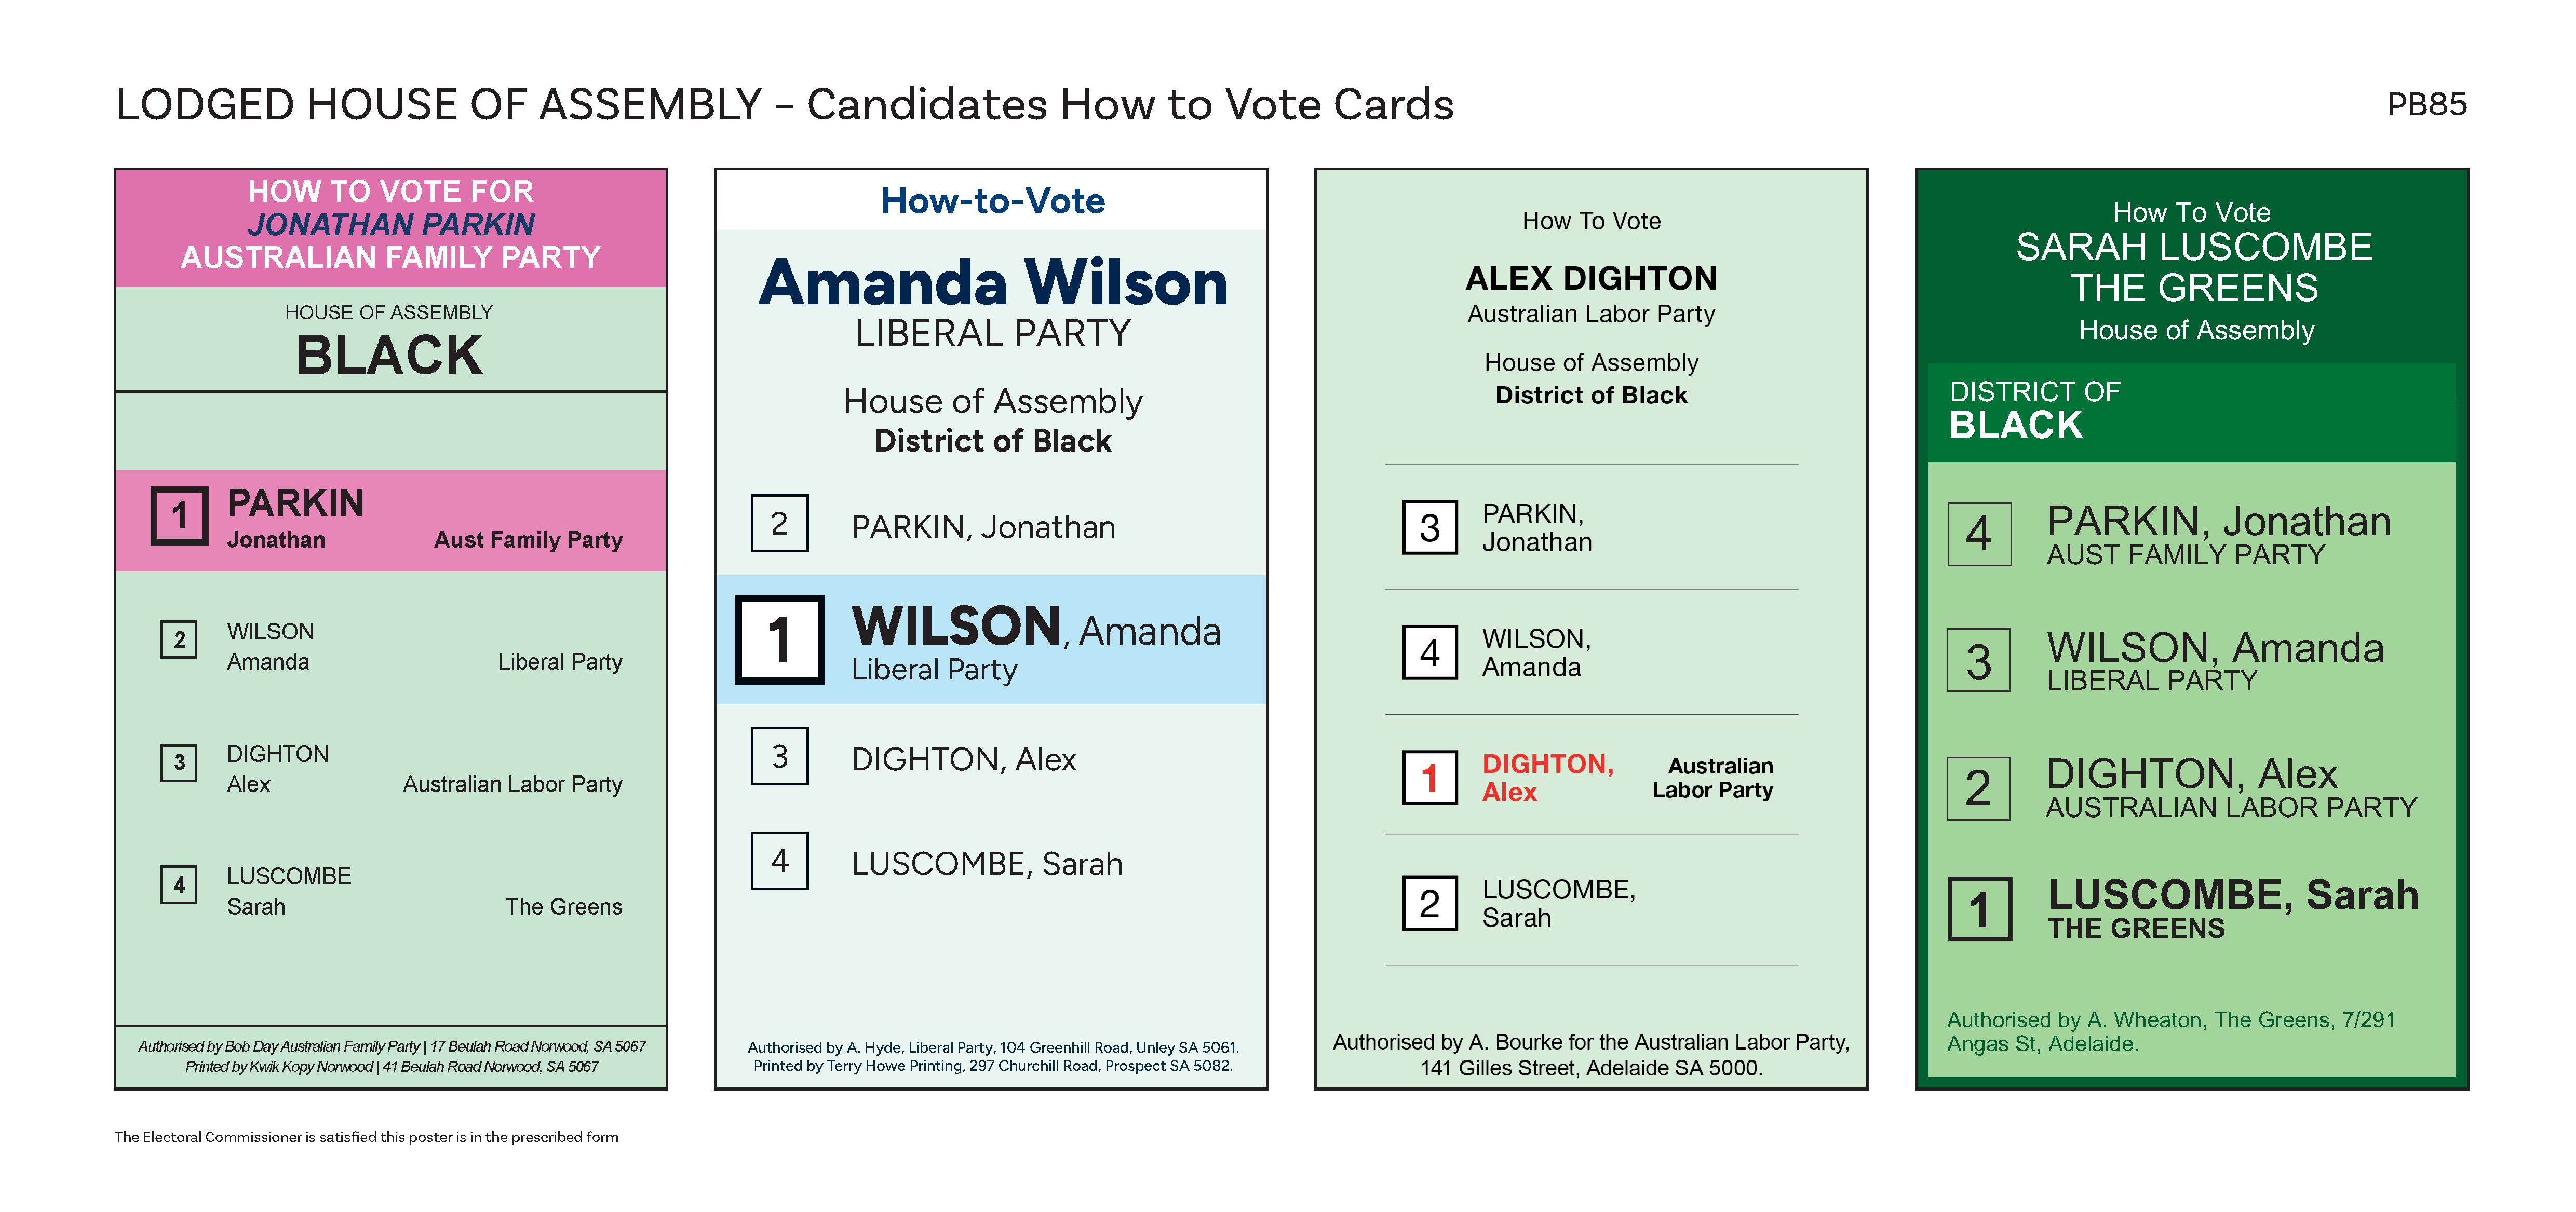
Declared candidates - how to vote cards
Declaration of nominations includes candidate names in ballot paper order
Declared institutions
as at 28 October 2024.
To assist residents of institutions such as nursing homes, hostels, convalescent homes, hospitals and corrective facilities, ECSA offer an Electoral Visitor Program to provide in-person voting facilities. Check the list below to see if your institution will be attended by our Electoral Visitors.
| Calvary Brighton Aged Care | 580 Brighton Road, South Brighton 5048 | ....as at 11 November postal voting will be offered |
| Anglicare SA - Trott Park | 4 Kangaroo Thorn Road, Trott Park 5158 | Wednesday 13 November 2024, 9:30am - 12:30pm |
Early voting locations for Monday 11 November – Friday 15 November
Voting has closed
Interstate voting locations for Monday 11 November – Friday 15 November
Voting has closed.
Polling locations for Saturday 16 November
Voting has closed
Postal vote applications
Voting has closed.
Tally - Daily election data updates - Accepted postal vote applications
Postal vote applications
| Date | Accepted postal vote applications | Cumulative total (of accepted postal vote applications) |
| Monday 4 November 2024 | 1,417 | 1,417 |
| Tuesday 5 November 2024 | 305 | 1,722 |
| Wednesday 6 November 2024 | 304 | 2,026 |
| Thursday 7 November 2024 | 100 | 2,126 |
| Friday 8 November 2024 | 197 | 2,323 |
| Monday 11 November 2024 | 103 | 2,426 |
| Tuesday 12 November 2024 | 135 | 2,561 |
| Wednesday 13 November 2024 | 95 | 2,656 |
| Thursday 14 November 2024 | 93 | 2,749 |
Tally - Daily election data updates - Postal envelopes returned
Postal envelopes returned
| Date | Postal envelopes returned | Cumulative total |
| Monday 11 November 2024 | 357 | 357 |
| Tuesday 12 November 2024 | 380 | 737 |
| Wednesday 13 November 2024 | 68 | 805 |
| Thursday 14 November 2024 | 281 | 1,086 |
| Friday 15 November 2024 | 469 | 1,555 |
| Monday 18 November 2024 | 31 | 1,586 |
| Tuesday 19 November 2024 | 275 | 1,861 |
| Wednesday 20 November 2024 | 267 | 2,128 |
| Thursday 21 November 2024 | 66 | 2,194 |
| Friday 22 November 2024 | 32 | 2,226 |
Tally - Daily election data updates - Early votes issued
Early votes issued
| Date | South Brighton EVC | Hallett Cove EVC | Total Early Votes |
| Monday 11 November 2024 | 425 | 754 | 1,179 |
| Tuesday 12 November 2024 | 515 | 1,039 | 1,554 |
| Wednesday 13 November 2024 | 607 | 1,028 | 1,635 |
| Thursday 14 November 2024 | 735 | 1,373 | 2,108 |
| Friday 15 November 2024 | 772 | 1,306 | 2,078 |
| Total | 3,054 | 5,500 | 8,554 |
Menu