Elections
Elections for South Australian government Superannuation Boards are held every three years and are composed of electing members to the Super SA, Funds SA and the Southern Select Super Corporation Boards. The 2024 elections will be comprised of:
- Election of two members to the Super SA Board
- Election of two members to the Southern Select Super Corporation Board
- Election of one member to the Funds SA Board.
Supplementary elections, for one or more Board Members, may be held if one or more positions becomes vacant.
Results
Funds SA
First preference votes
Below are the first preference votes received by the candidates in the order they appeared on the ballot paper.
| Candidate | First preference votes | Percent | Elected or Excluded |
| GRIGGS, William (Bill) | 5,538 | 33.93% | Elected |
| CHARLTON, Sue-Ann | 3,841 | 23.53% | |
| WRIGHT, Jamie | 1,701 | 10.42% | Excluded |
| RANTANEN REYNOLDS, Nicolle | 2,527 | 15.48% | Excluded |
| DAY, Mark | 2,715 | 16.63% | Excluded |
| Total | 16,322 |
Distribution of preferences - Final result
After the distribution of preferences, William (Bill) GRIGGS was declared elected.
To view the distribution of votes refer to the Scrutiny sheet
Super SA
First preference votes
Below are the first preference votes received by the candidates in the order they appeared on the ballot paper.
| Candidate | First preference votes | Percent | Elected or Excluded |
| KIMBER, Alison | 2,275 | 14.28% | ELECTED |
| DOWNIE, Domenique | 1,208 | 7.58% | Excluded |
| ZIMMERMANN, Alex | 1,309 | 8.22% | Excluded |
| TAYLOR, Sarah | 977 | 6.13% | Excluded |
| KOKAR, Emma | 1,371 | 8.61% | Excluded |
| DAMIN, John | 422 | 2.65% | Excluded |
| WRIGHT, Jamie | 1,184 | 7.43% | Excluded |
| RANTANEN REYNOLDS, Nicolle | 1,373 | 8.62% | Excluded |
| MULHOLLAND, Bernadette | 1,166 | 7.32% | Excluded |
| GRIGGS, William (Bill) | 3,166 | 19.88% | ELECTED |
| CHARLTON, Sue-Ann | 1,478 | 9.28% | |
| Total | 15,929 |
Distribution of preferences - Final result
After the distribution of preferences William (Bill) GRIGGS and Alison KIMBER was declared elected
To view the distribution of votes refer to the Scrutiny sheet
Daily Returns
Super SA Board
Elections for the South Australian Superannuation Board are held every three years. The Board has two Board positions that are elected by members. The role of the Board is to provide leadership, strategic guidance and management oversight of Super SA.
Funds SA Board
Elections for the Funds SA Board are held every three years. The Board has one Board position that is elected by members. Funds SA is the investment management partner for South Australian public sector superannuation funds and approved authorities.
Southern Select Super Corporation
Elections for the Southern Select Super Corporation are held every three years. The Southern Select Super Corporation Board has two Board positions that are elected by members.
The role of the Southern Select Corporation Board is to act as Trustee and administer the Trust Deed and Rules of the Super SA Select Fund.
At the close of nominations at 12 noon, Monday 22 July 2024 no nominations were received and accepted for the election of two Members to the Super SA Select Board.
As a result, no election will occur for the Super SA Select Board.
Timetable
| Event | Date |
| Roll close | Friday 28 June 2024 |
| Nominations open | Monday 8 July 2024 |
| Nominations close | 12 noon, Monday 22 July 2024 |
| Ballots open | Monday 12 August 2024 |
| Ballots close | 12 noon Monday 9 September 2024 |
| Scrutiny and Count | Tuesday 10 September to Wednesday 11 September 2024 |
| Declaration of Elections | Wednesday 11 September 2024 |
Enrolment
Close of Roll: 5pm Friday 28 June 2024
Under Part 2.7 of Superannuation Regulations 2016, the following are persons eligible to vote:
(a) contributors as defined in section 4(1) of the Act;
(b) members or spouse members of the Triple S scheme; or
(c) persons provided with investment services or other products or services pursuant to regulations under section 30(2)(g) of the Southern State Superannuation Act 2009,
on the last business day before the 7 day period immediately preceding the day on which notice was published under regulation 6.
In this election, the roll close date is 5pm Friday, 28 June 2024.
Voting will be by ballot paper delivered to the address linked to members’ Super SA or SA Police Super account (as the case may be) and eligible members will be further notified of how to vote.
However, to receive voting packs and cast votes, members will need to ensure their postal address details are up to date by 5pm Friday, 28 June 2024.
Super SA members—please update your postal address via the member portal at supersa.sa.gov.au or call Super SA on (08) 8214 7800.
SA Police Super member—please update your postal address by calling SA Police Super on (08) 8470 0370 or email
Nominating
Nominations open: Monday 8 July 2024
A nomination for election must be—
(a) in a form approved by the Electoral Commissioner; and
(b) signed by at least 3 voters; and
(c) received by the Electoral Commissioner at or before the hour of nomination.
Potential candidates may obtain nomination forms (downloadable form below), via an email request to
It is recommended that the details of more than the minimum 3 nominators are provided on your nomination form in case any of the nominators are found to be ineligible during the nominator checking process.
A candidate may provide promotional material of not more than 200 words in support of their nomination plus one photograph which will be printed and enclosed with the ballot materials provided to voters. This promotional material should be included with the nomination form and both must reach the Electoral Commissioner nomination closure.
It is preferred that completed nomination forms and promotional material be emailed to
Nominations will only be accepted once the nomination period has begun i.e. Monday 8 July 2024.
Nominations and candidate promotional material will be unable to be amended once nominations close.
Nominations close: 12 noon Monday 22 July 2024
Super SA Board
Candidate nominators must be persons eligible to vote. Persons eligible to vote must be contributors within the meaning of the Police Superannuation Act 1990, the Superannuation Act 1988, or a member or spouse member of the Southern State Superannuation (Triple S) Scheme or a person provided with investment services or other products or services pursuant to regulations under section 30(2)(g) of the Southern State Superannuation Act 2009; as at 5pm Friday 28 June 2024.
To nominate for the Super SA candidate, download and complete this form
Funds SA Board
Candidate nominators must be persons eligible to vote. Persons eligible to vote must be contributors within the meaning of the Police Superannuation Act 1990, the Superannuation Act 1988, or a member or spouse member of the Southern State Superannuation (Triple S) Scheme or a person provided with investment services or other products or services pursuant to regulations under section 30(2)(g) of the Southern State Superannuation Act 2009; as at 5pm Friday 28 June 2024.
Eligibility Criteria
In accordance with Section 9(3) of the Superannuation Funds Management Corporation of South Australia Act 1995, persons eligible to nominate must:
- have obtained a degree, diploma or other qualification with an emphasis on law, accountancy, economics, commerce, mathematics, statistics, investment or financial management from an institution of tertiary education; or
- have had at least five years experience in:
- the investment and management of superannuation funds or other substantial sums of money; or
- business management; or
- financial management in the banking sector; or
- asset management; or
- auditing; or
- any other area that is relevant to the performance by the Authority of its functions,
or at least five years’ experience in two or more of those areas.
To nominate for the Funds SA Board candidate, download and complete this form.
Southern Select Super Corporation
Candidate nominators must be persons eligible to vote. Persons eligible to vote must be members of Super SA Select as at 5pm Friday 28 June 2024.
To nominate for the Super SA Select candidate, download and complete this form.
Super SA Select Nomination Form (PDF, 154KB)
List of candidates
Super SA Board
In accordance with Regulation 5 of the Superannuation Regulations 2016, a draw to determine the order of candidate names to appear on the ballot paper was held at 2pm on Monday 22 July 2024.
Watch a recording of the Ballot Paper Draw
The below is the result of the ballot paper draw for the Super SA Board election.
Profiles and photos for each of the 11 candidates are displayed below in the same order as their names appear on the ballot paper. This information has been provided by the candidate and neither the Electoral Commissioner nor Super SA take responsibility or bear liability for the content contained within.

Alison KIMBER
Alison Kimber is passionate about superannuation and is keen to continue to contribute to the Super SA Board and to look out for members’ best interests through a time of volatility and change, using her approachable style and her financial, risk management, governance and service delivery skills. Alison has nearly 20 years’ experience as a public servant and 10 years’ experience in the private sector. She is a member of Super SA and has a genuine care for the interests of all members. A qualified actuary, Alison is highly skilled in finance and risk management. She has a background in international banking and capital markets which helped develop her commercial acumen, as well as considerable experience in government policy and the delivery of community services. Alison has been a non-executive board director since 2009 and actively contributes to the community as a volunteer and mentor. She currently serves on the boards of Super SA, the City Renewal Authority (ACT) and the Can:Do Group. Alison is a Fellow of the Australian Institute of Company Directors and is an elected member of its SA Council.

Domenique DOWNIE
I am honored to submit my nomination for the Super SA Board. With a distinguished career spanning more than a decade in superannuation, I bring a wealth of experience that aligns with Super SA's mission and values. I possess extensive knowledge of Super SA's product offerings, investment portfolio, and its unique status as a constitutionally protected fund with strong government ties. Previously, as the Head of Corporate & Public Affairs at Hostplus, I provided corporate affairs support and strategic advice, developing and managing both external and internal communication strategies. I worked closely with the CEO and Executive team to protect Hostplus’s reputation and effectively manage media relations and stakeholder engagement. My role involved responding to current affairs, policy changes, and media sentiment, ensuring that the Fund's reputation remained robust. At Statewide Super, as the Head of Strategic Communications & Public Affairs, I was responsible for all internal and external strategic communications and public relations. I managed media relations during the Royal Commission into the Banking and Financial Services sector, successfully advocated for legislative changes, and developed proactive communication strategies that enhanced the organisation's public image. My commitment to excellence, strategic thinking, and ability to translate complex issues into actions will
Alex ZIMMERMANN
No-one can underestimate the importance of money you invest in Super SA superannuation. As a long-term member of Super SA, I believe the right board members are key elements in the performance of the organisation. I offer you someone with an extensive track record of leadership and achievement as evidenced in my current role as the Chair of two significant SA entities: Police Credit Union SA/NT (which is one of the most awarded and best-known credit unions in SA) and Workskil Australia (the largest not for profit general employment service provider in Australia). As such, I have significant experience in the areas of governance, finance and business strategy which will benefit the Board of Super SA. Additionally, I was a senior manager in SA Police for many years before being appointed by successive governments as the Community Recovery Coordinator to help individuals and communities impacted by devastating natural disasters. As a Board member of Super SA I will serve you, the member, with equal dedication. I’m a fellow of both the Australian Institute of Company Directors and the Governance Institute of Australia. If elected I will work for you with the professionalism, integrity and diligence you expect and deserve.
Sarah TAYLOR
I am seeking your support for election to the Super SA board. I am driven by a commitment to stability, growth, and transparency and possess over 20 years’ experience in finance, strategic management and governance. I am a Chartered Practicing Accountant (CPA) and a graduate of the Australian Institute of Company Directors (AICD), I am currently completing a Master of Business Administration (MBA). As a previous employee of Super SA and a prior member of NFP Boards, I am confident in my ability to bring knowledge and expertise to the board and believe that my experience has equipped me with the necessary skills to provide critical direction in relation to governance, financial performance reporting and strategic planning. I have a passion for ethical governance and sustainable business practices and would aim to ensure that the board is kept abreast of the activities that Super SA is embarking on in this space, not only from an investment point of view, but also from a corporate governance perspective. As a board member my focus would be on ensuring that members continue to have clear and frequent communication about investments and future-plans, accessible updates on fund performance and transparency over decision-making.
Emma KOKAR
Emma Kokar is a highly experienced senior Departmental executive and regulator, who is passionate about cyber security and keeping your data and superannuation safe. As the Registrar of Motor Vehicles, Emma has highly relevant and up-to-date experience in dealing with the severe consequences of data breaches and identity theft and is very keen to use this to help protect her fellow Super SA members. Emma is also a strong believer in regular board renewal and that the Super SA board should include representation from members who are still contributing to their superannuation. Emma is an experienced director who has been on Government boards at the national level, including Austroads and Transport Certification Australia. Emma has graduated from the Australian Institute of Company Directors and holds a Bachelor of Commerce (Accounting). Emma believes she has the right mix of experience, financial acumen and tech savvy to help ensure Super SA members have nest eggs that are safe and growing well.

John DAMIN
John continues to pursue part time interests in independent board membership and business advisory consulting. Prior to retirement John was the Director Financial Strategy in the Department of Premier and Cabinet. As a former FCPA and a budget branch Director in the Department of Treasury and Finance, he met regularly with the Treasurer to provide financial and policy advice. He also has experience in customer service organisations. As well as executive leadership roles, John has had experience on several government boards and committees. John understands the superannuation needs of working and retired Super SA members and seeks to represent your interests on the Super SA Board. Service excellence for members and a safe and secure superannuation management and administration strategy are John’s main ambitions in seeking this opportunity to represent members.

Jamie WRIGHT
Dear members, My name is Jamie Wright and I have over 25 years’ experience in financial markets and with companies as a director, leader and corporate adviser. I have been involved in more than $10billion in transactions and have a track record creating value for investors.
I believe my skills will strengthen the Board to seek stronger returns for members and modernise the fund. I will prioritise a 'members first' culture and strive for positive changes that benefit members and the community. I am currently Managing Director of RJW Capital, which provides corporate advisory services; Director of Cherish Metals; Director of Community Living Options; and Chair the Governing Council of the Australian Science and Mathematics School. I was previously Managing Director of Global Lithium, which I led to become a top-performing company on ASX and gained extensive advisory experience with leading investment bank, RFC. A proud South Australian, I am passionate about our wonderful state. My beautiful wife is a member and schoolteacher, and both my son’s volunteer. I would welcome any member to contact me on jamie.wright@rjwcapital.com.au, or visit https://jamiewright04.wixsite.com/jamie-nomination Thank you. Jamie, Grad. Dip. Applied Finance and Investment, B.Sc, B.Eng (Hons), AICD Company Directors Course.
Nicolle RANTANEN REYNOLDS
Nicolle's experience spans 30 years working in public and private sector organisations across finance, superannuation, legal and service delivery functions. This includes SuperSA (Director Strategy/Member Services), Statewide Super (COO) and the Department of Treasury & Finance (COO). She is an experienced Board Director with exceptional governance skills, risk expertise and commercial acumen. Her qualifications include AICD Graduate (Fellow), CPA (Fellow), MBA and Masters in Commercial Law. She uses exemplary commercial, legal and finance skills to understand and analyse financial information, assess business drivers, interpret regulation and provide insight into opportunities to deliver substantial organisational value. Nicolle's current Board roles include: Adelaide University Council, AICD State Council, LLL Australia (Finance) and President, Grange Golf Club. Nicolle was until recently, Chief Executive of the Public Trustee - 200 staff with responsibilities including corporate strategy, financial management and investment of $1.5 billion. Having worked in the superannuation industry, Nicolle understands the importance of board governance for members. Nicolle's experience in delivering superannuation services allows her to provide oversight with an understanding of the service expectations of members. Continuing to serve and add sustainable value to the public sector community remains an important personal objective as part of her director portfolio responsibilities.
Bernadette MULHOLLAND
With qualifications and experience in law, economics, accounting and industrial relations, I can bring the Super SA Board a wealth of experience and a firm commitment to members that the fund will be run for the benefit of all members. I have been employed for many years in a range of member-focused roles that have provided direct contact with Super SA, including at the Public Service Association, the Australian Education Union (SA Branch) and in my current role for more than a decade as Chief Industrial Officer of the South Australian Salaried Medical Officers Association. At the Association we have achieved a financially high-performing organisation that focuses on working hard in the best interests of members. As a member of the Super SA Board I would bring the same approach, listening, communicating and working hard for members to meet your expectations and achieve your goals and objectives. I am committed to ethical decision-making, transparency, robust governance and compliance, while bringing a forward-thinking vision to innovative technologies and adapting to industry changes to enhance fund performance. My analytical abilities and critical thinking have driven successful outcomes for members of SASMOA. I will bring the same inclusive approach at Super SA.
William (Bill) GRIGGS
Dr William Griggs AM ASM. During my medical career I believe I consistently demonstrated a high level of dedication, passion, and care for others. From a business perspective, in 2009 I completed an MBA (Adelaide University) and became a Fellow of the Australian Institute of Company Directors (FAICD). Since the 1990s I have served on the Boards of various Not-for-Profit organizations, currently serving as a Board Member and the Commissioner (Senior Volunteer) for St John Ambulance (SA). I have been an elected Board Member of Super SA since 2009 and of Funds SA since 2018. I am also a Board Member of Return to Work SA (since 2013) and currently Chair their Investment and Finance Committee. A past Chair of the Motor Accident Commission, I have strong interests in finance, investments and governance. I am very keen to continue to ensure that members interests and investments are well looked after in an increasingly complex and challenging world. I believe this Board role is one for which I have appropriate skills and experience and hope I can continue to serve my fellow South Australians. Thank you for taking the time to read this.
Sue-Ann CHARLTON
It would be my honour and privilege to serve the Board of Super SA and provide guidance in respect of our superannuation fund. I have over 25 years’ experience in Financial Services, including 12 years in leadership at the Mercer Super Trust which is now a $65bn fund. I qualified as a Certified Financial Planner in 1998 and spent many years assisting people in developing investment strategies and structuring their superannuation to provide the best possible retirement. My qualifications include a Bachelor of Business, Diploma of Financial Planning, Master of Education and I am a graduate of the Australian Institute of Company Directors. I have significant experience in superannuation, but most importantly (and those who know me will attest) I genuinely care about people – and superannuation is ultimately all about people. It is our money and it is critical that it is well-governed to ensure we maximise our retirement savings when we are finally ready to enjoy the next phase of our lives. My strong background in the highly regulated area of financial planning and investment has ensured that working within regulatory frameworks, good governance, financial acumen and sound decision-making are part of my DNA.
Funds SA
In accordance with Regulation 4 of the Superannuation Funds Management Corporation of South Australia Regulations 2010, a draw to determine the order of candidate names to appear on the ballot paper was held at 2pm on Monday 22 July 2024.
Watch a recording of the Ballot Paper Draw
The below is the result of the ballot paper draw for the Funds SA Board election.
Profiles and photos for each of the 5 candidates are displayed below in the same order as their names appear on the ballot paper. This information has been provided by the candidate and neither the Electoral Commissioner nor Funds SA take responsibility or bear liability for the content contained within
William (Bill) GRIGGS
Dr William Griggs AM ASM. During my medical career I believe I consistently demonstrated a high level of dedication, passion, and care for others. From a business perspective, in 2009 I completed an MBA (Adelaide University) and became a Fellow of the Australian Institute of Company Directors (FAICD). Since the 1990s I have served on the Boards of various Not-for-Profit organizations, currently serving as a Board Member and the Commissioner (Senior Volunteer) for St John Ambulance (SA). I have been an elected Board Member of Funds SA since 2018 and of Super SA since 2009. I am also a Board Member of Return to Work SA (since 2013) and currently Chair their Investment and Finance Committee. A past Chair of the Motor Accident Commission, I have strong interests in finance, investments and governance. I am very keen to continue to ensure that members investments and interests are well looked after in an increasingly complex and challenging world. I believe this Board role is one for which I have appropriate skills and experience and hope I can continue to serve my fellow South Australians. Thank you for taking the time to read this.
Sue-Ann CHARLTON
It would be my honour and privilege to serve the Board of Funds SA and provide guidance in respect of the investments behind our superannuation fund. I have over 25 years’ experience in Financial Services, including 12 years in leadership at the Mercer Super Trust which is now a $65bn fund. I qualified as a Certified Financial Planner in 1998 and spent many years assisting people in developing investment strategies and structuring their superannuation to provide the best possible retirement. My qualifications include a Bachelor of Business, Diploma of Financial Planning, Master of Education and I am a graduate of the Australian Institute of Company Directors. I have significant experience in superannuation, but most importantly (and those who know me will attest) I genuinely care about people – and superannuation is ultimately all about people. It is our money and it is critical that it is well-governed to ensure we maximise our retirement savings when we are finally ready to enjoy the next phase of our lives. My strong background in the highly regulated area of financial planning and investment has ensured that working within regulatory frameworks, good governance, financial acumen and sound decision-making are part of my DNA.
Jamie WRIGHT
Dear members, My name is Jamie Wright and I have over 25 years’ experience in financial markets and with companies as a director, leader and corporate adviser. I have been involved in more than $10billion in transactions and have a track record creating value for investors.
I believe my skills will strengthen the Board to seek stronger returns for members and modernise the fund. I will prioritise a 'members first' culture and strive for positive changes that benefit members and the community. I am currently Managing Director of RJW Capital, which provides corporate advisory services; Director of Cherish Metals; Director of Community Living Options; and Chair the Governing Council of the Australian Science and Mathematics School. I was previously Managing Director of Global Lithium, which I led to become a top-performing company on ASX and gained extensive advisory experience with leading investment bank, RFC. A proud South Australian, I am passionate about our wonderful state. My beautiful wife is a member and schoolteacher, and both my son’s volunteer. I would welcome any member to contact me on
Nicolle RANTANEN REYNOLDS
Nicolle's experience spans 30 years working in public and private sector organisations across finance, superannuation, legal and service delivery functions. This includes SuperSA (Director Strategy & Member Services), Statewide Super (COO) and the Department of Treasury & Finance (COO). She is an experienced Board Director with exceptional governance skills, risk expertise and commercial acumen. Her qualifications include AICD Graduate (Fellow), CPA (Fellow), MBA and Masters in Commercial Law. She uses exemplary commercial, legal and finance skills to understand and analyse financial information, assess business drivers, interpret regulation and provide insight into opportunities to deliver substantial organisational value. Nicolle's current Board roles include: Adelaide University Council, AICD State Council, LLL Australia (Finance) and President, Grange Golf Club. Nicolle was until recently, Chief Executive of the Public Trustee - 200 staff with responsibilities including corporate strategy, financial management and investment of $1.5 billion. Having worked as Public Trustee and in the superannuation industry, Nicolle has experience in managing investment portfolios, setting and monitoring investment strategy, making pricing decisions, participating in fund manager selection and sourcing investment consultants. Continuing to serve and add sustainable value to the public sector community remains an important personal objective as part of her director portfolio responsibilities.

Mark DAY
As a career finance executive/Director, I have seen the SSS returns underperform for many years. My objective in joining the Board of Funds SA is to ensure SA Government employees are rewarded with superannuation investment returns that are consistently (at least) second quartile as I achieved in my over 8+ year term as Chair of both the Investment Committee and the Board, of Electricity Industry Super. As Government employees we are compelled to place our super contributions into Super SA. As such, it is imperative that our Funds SA investment outcomes are competitive. According to Super Ratings industry median benchmarks, the SSS Balanced fund (60% - 90% growth assets) does not consistently achieve this minimum hurdle. I want to be your representative on the Funds SA Board. Once on the Board I will be able to determine why its investment performance is average (at best) and do all that I can to ensure that its performance lifts to a consistent “second quartile” level across all investment options. And so, I ask that you please consider my background, career in finance and directorship history (at LinkedIn) and vote me onto the Funds SA Board as your representative.
Super SA Select Board
As a result, no election will occur for the Super SA Select Board.
Voting
Following the close of nominations, elections will be held for Members of the following Boards:
- Super SA Board
- Funds SA Board
Voting packs will be sent to all eligible electors from Monday 12 August 2024. Eligible electors include the following:
- Super SA members are entitled to vote in the Super SA Board election as well as in the Funds SA election as members of Funds SA.
- Police Superannuation members are entitled to vote in Funds SA only.
- Super SA Select members who choose to be members of Super SA are entitled to vote in the Funds SA and Super SA elections.
Voting packs for Super SA and Super SA Select members will include the following:
- one ballot paper for the Super SA Board Election;
- one ballot paper for the Funds SA Board Election;
- a combined candidate profile sheet for these elections;
- a postal voting guide;
- a ballot paper declaration envelope bearing your name and address; and
- a reply-paid envelope to return your ballot paper declaration envelope in.
Voting packs for Funds SA only members will include the following:
- one ballot paper for the Funds SA Board Election;
- a candidate profile sheet for this election;
- a postal voting guide;
- a ballot paper declaration envelope bearing your name and address; and
- a reply-paid envelope to return your ballot paper declaration envelope in.
The voting method for these elections is optional preferential.
In both elections, for your vote to count you must place the number 1 in the square opposite the name of the candidate whom you most prefer.
You may then indicate further preferences for some or all of the other candidates by placing consecutive numbers in the square(s) opposite their name(s), commencing with the number 2.
Requesting a replacement ballot pack
If you haven't automatically received your ballot material by Monday 19 August 2024, and you believe you are entitled to vote, please contact ECSA on 1300 655 232. The deadline you can apply for replacement voting material is 5 pm on Monday 2 September 2024.
You can request a replacement ballot pack if you have been left off the roll in error, or the original material was:
- not received
- destroyed or lost
- spoiled
Returning your ballot paper
After voting, your completed ballot paper(s) must be placed in the ballot paper envelope, which is then sealed and signed by you to verify your identity and voting entitlement. The signed flap of the ballot paper envelope will be removed by electoral staff prior to opening the envelope to ensure the secrecy of your vote.
Place your completed ballot paper envelope into the reply-paid envelope and post it back to ECSA so that it reaches ECSA by no later than 12 noon Monday 9 September 2024.
Elections for the South Eastern Water Conservation and Drainage Board (the Board) are held every four years. The Board has one member for each of the following electoral zones - Central Electoral Zone, Northern Electoral Zone and Southern Electoral Zone.
This election was held in July 2024. The outcome of the elections were:
Central Electoral Zone
- Brett McLaren (elected unopposed)
Northern Electoral Zone
- Miles Weston Hannemann (elected unopposed)
Southern Electoral Zone
- Joanne Betty Feast (elected through postal ballot)
Timetable
| Event | Date |
| Roll close | 5pm, Tuesday 11 June 2024 |
| Nominations open | Tuesday 11 June 2024 |
| Nominations close | 12 noon, Tuesday 25 June 2024 |
| Dispatch of ballot material to electors | From Friday 5 July 2024 |
| Close of voting | 10am, Monday 29 July 2024 |
| Scrutiny and Count | Tuesday 30 July 2024 |
Candidates
At the close of nominations at 12 noon on Tuesday 25 June 2024 the following nominations were received and accepted:
Central Electoral Zone
- Brett McLaren
Northern Electoral Zone
- Miles Weston Hannemann
Southern Electoral Zone
- Joanne Betty Feast
- Michael Black
With a single nomination accepted for the single vacancy for the Northern Electoral Zone and a single nomination accepted for the single vacancy for the Central Electoral Zone, these candidates were elected unopposed (no election required).
With two nominations accepted for the single vacancy for the Southern Electoral Zone, an election was required.
Election results for Southern Electoral Zone
Count Summary
|
Enrolled voters: |
1253 |
|
Envelopes returned: |
354 |
|
Envelopes accepted: |
332 |
|
Envelopes rejected: |
22 |
|
Voter participation: |
354 (28.25% of the total enrolment) |
|
Formal votes: |
322 |
|
Informal votes: |
0 |
|
Absolute majority: |
162 |
First preference votes
Below are the first preference votes received by the candidates in the order they appeared on the ballot paper. Percentages have been rounded to two decimal places.
|
Candidate |
First pref. votes |
Percentage |
|
FEAST, Joanne Betty |
173 |
52.1% |
|
BLACK, Michael |
159 |
47.9% |
Distribution of preferences
As Joanne Betty Feast obtained an absolute majority, she has been declared elected.
FEAST, Joanne Betty

I’m a 52yr old mother of 2 boys aged 25 and 14 years living at Green Point, Wye SA for 33 years. Before children, I was an Enrolled Nurse, working for a Private Doctor in Mt Gambier for 7 years. As a child, I grew up on a market garden farm at Yahl. I’ve been a fulltime farmer since 2005 after my husband of 13 years, passed away from Cancer. Since then I have managed, worked and improved our 1500 Acre family farm that has been owned by the Feast family at Green Point, since the late 1880’s. My eldest son Morgan is the 5th Generation poised to take over the farming enterprise. Our farm runs 100% Merino Ewes for wool production with some crossbred mating for Prime Lamb Production, we also breed Black Angus and Poll Hereford cattle as well. We balance dry land farming with the ecosystems on our farm which comprises of over 300 Acres of wetland, 2 Karst Rising Springs and 2 drains. I am very concerned and passionate about the natural environment, water conservation, its usage, management and its sustainability. I am proactive in re-vegetation of areas of our wetlands for bird habitat, protection and conservation. I also help my fiancée, Graham Kilsby, in managing booking systems and correspondence for Kilsby Sinkhole and its newly built Villa Accommodation. I am passionate about the environment with real life experiences dealing with wetlands, drains and the ecosystems that depend on them.
BLACK, Michael
I am a third generation dairy farmer in the Eight mile Creek area and have a keen interest in the long term sustainability of farming in the Limestone coast as well as maintaining our environment to ensure a long-term future in the region. I would like to see the future of the drainage board being able to continue to uphold its commitments in keeping the drainage network working effectively and being well maintained. As a landholder with several drains on my property I have a strong appreciation for the importance of the network on our local agricultural industry and hope to be able to support the drainage board in continuing its work ensuring the network continues effectively into the future. I aspire to see our reliable climate, quality soils and unique water resources used to produce food and fibre as efficiently and sustainably as possible, and look forward to contributing my time and support to the Drainage Board in furthering these aims.
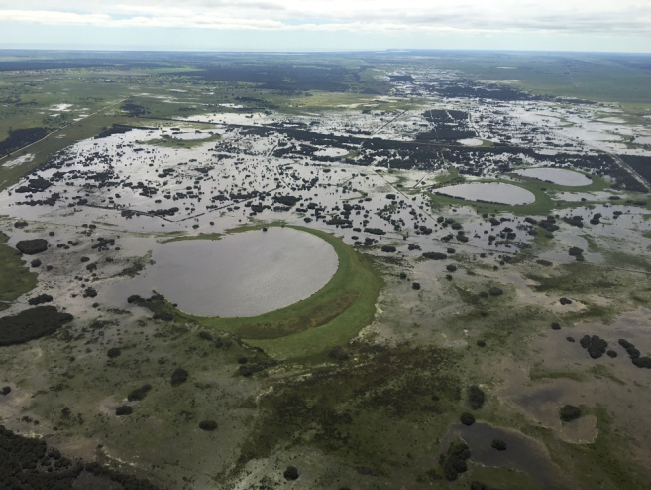
The SEWCD Board has a long history of local and regional management of flooding, surface water and drainage in the South East.
A supplementary election of one eligible Landholder to the South Eastern Water Conservation and Drainage Board Northern Electoral Zone was called.
The election is to select one eligible Landholder Member from the following Electoral Zone:
NORTHERN ELECTORAL ZONE – comprising the Tatiara District Council (except Hundreds of Glenroy and Fisk) and part Coorong District Council (including Hundreds of Glyde, Field, Colebatch, Richards, Coombe, Archibald, Makin, Santo, Messent, McNamara).
Timetable
| Event | Date |
| Roll close | 5pm, Monday 18 August 2025 |
| Nominations open | Monday 18 August 2025 |
| Nominations close | 12 noon, Monday 1 September 2025 |
| Dispatch of ballot material to electors | From Friday 12 September 2025 |
| Close of voting | 10am, Tuesday 7 October 2025 |
| Scrutiny and Count | Wednesday 8 October 2025 |
At the close of nominations at 12 noon on Thursday 11 July 2024, the number of candidates was not more than the number of vacancies and the following person was duly elected.
North Ward Councillor – 1 vacancy
EIME, Brian Eric – elected unopposed
List of candidates
In accordance with the Local Government (Elections) Act 1999 (section 25), the candidate below was declared elected. This result was announced following the close of nominations, 12 noon Thursday 11 July 2024.
Watch the recorded Live stream

EIME, Brian Eric
I am fortunate to be a fourth generation Eime that enjoys being involved and working for the Blyth Community. Born and educated at Blyth Primary School and secondary education at Scotch College, Torrens Park. Following school education, I was invited to join the Clare Rural Youth Club. The pledge recited at the commencement of each meeting went something like this, " I promise to do my best to lead a clean and honest life, to help others at all times, so help me God". Rural Youth was a wonderful organisation that installed many skills for life, including supporting the community. Positions held in the community include President Tennis Club, Chairman Blyth School Council when Kybunga transferred to Blyth, Chairman of the Institute during the addition of the annex, President Bowling Club three separate terms and treasurer six years building new shelters and replacing green . As a former Citizen of the year I would be honored to represent the Northern Ward of Wakefield Regional Council.
I live in the North Ward | Contact Details:
Timetable
| Event | Legislation* | Date |
|
Close of rolls |
s 6(7)(a), s 15(9)(b) |
5pm, Friday 31 May 2024 |
|
Nominations open |
s 19(4) |
Thursday 27 June 2024 |
|
Online candidate briefing session |
6.00pm Thursday 27 June 2024 | |
|
Nominations close |
s 23(b) |
12 noon, Thursday 11 July 2024 |
|
Draw for positions on the ballot paper |
s 29(3)(b) |
2.00pm Thursday 11 July 2024 |
|
First campaign donation return due |
s 80(3)(a)(ii) | Thursday 18 July 2024 to Thursday 25 July 2024 |
| Second campaign donation return due | s 80(3)(b) |
Within 30 days of the 'conclusion of the election' |